| Metric | Count | Percentage | |
|---|---|---|---|
| 0 | Active customers | 60826 | 48.7% |
| 1 | Churned customers | 64174 | 51.3% |
| Overall churn rate | 51.3% |
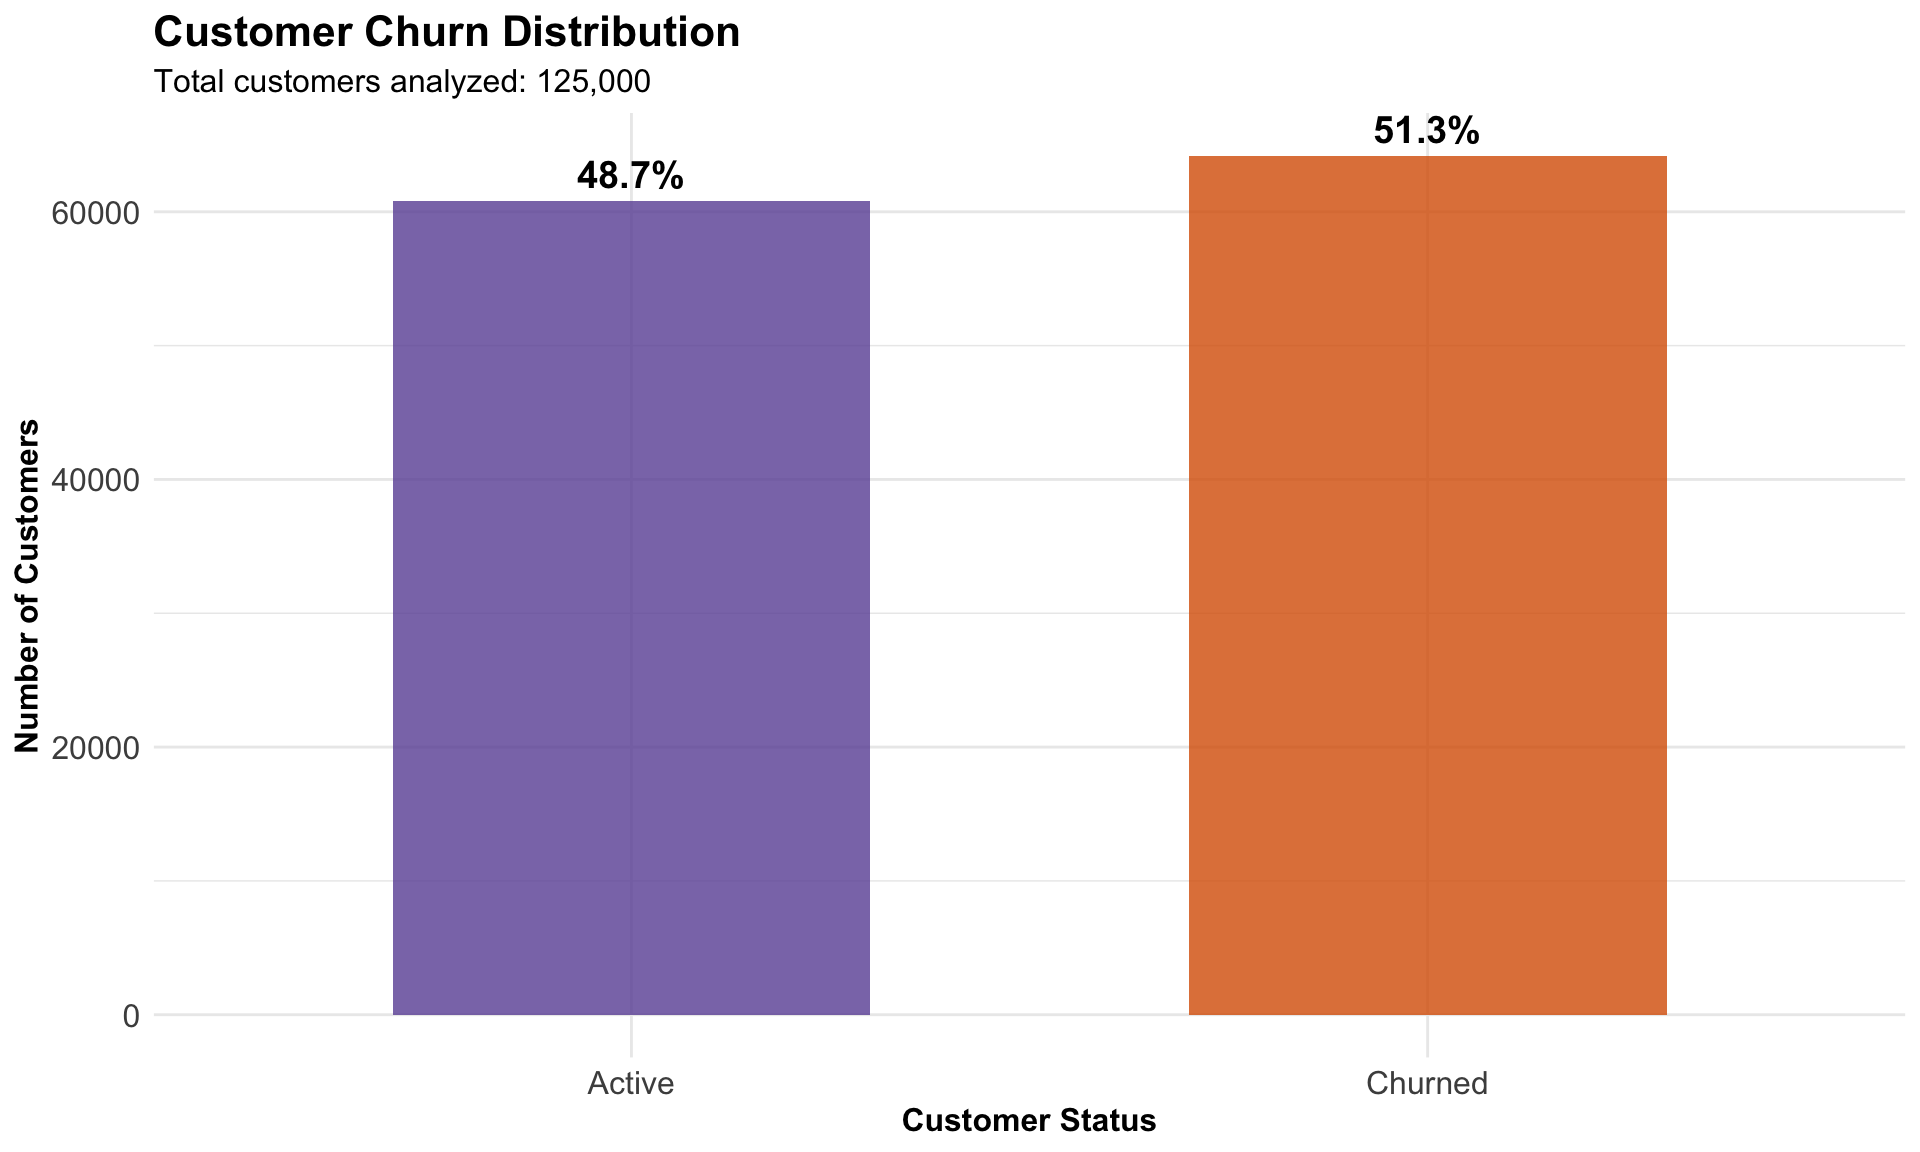
Customer Churn Distribution
PlaylistPro Subscription Churn
Customer churn is a major challenge for PlaylistPro, affecting nearly half of the subscriber base. This report provides a first step toward addressing it by describing what the data tells us about our customers today. The goal is not yet to predict or prescribe solutions, but to establish a clear picture of who our customers are, how they use the serive, and how churn differs across groups. These insights will set the stage for building predictive models and designing targeted retention strategies.
The target variable is churned (binary: 0 = active customer, 1 = churned customer).
| Metric | Count | Percentage | |
|---|---|---|---|
| 0 | Active customers | 60826 | 48.7% |
| 1 | Churned customers | 64174 | 51.3% |
| Overall churn rate | 51.3% |
Customer Churn Distribution
The churn distribution is nearly even, indicating a systemic retention challenge rather than a niche issue. This balance split guides our visualization strategy by comparing customer segments, behaviors, and service patterns to pinpoint the areas most correlated with churn.
| variable | min | q1 | median | q3 | max | mean | sd |
|---|---|---|---|---|---|---|---|
| age | 18.000 | 33.000 | 48.000 | 64.000 | 79.000 | 48.414 | 17.901 |
| average_session_length | 1.001 | 30.644 | 60.341 | 90.234 | 119.997 | 60.422 | 34.384 |
| notifications_clicked | 0.000 | 12.000 | 24.000 | 37.000 | 49.000 | 24.447 | 14.423 |
| num_favorite_artists | 0.000 | 12.000 | 25.000 | 37.000 | 49.000 | 24.500 | 14.446 |
| num_platform_friends | 0.000 | 50.000 | 100.000 | 150.000 | 199.000 | 99.713 | 57.681 |
| num_shared_playlists | 0.000 | 12.000 | 25.000 | 37.000 | 49.000 | 24.554 | 14.455 |
| num_subscription_pauses | 0.000 | 1.000 | 2.000 | 3.000 | 4.000 | 1.991 | 1.417 |
| signup_date | -2922.000 | -2190.000 | -1462.000 | -728.000 | -1.000 | -1460.679 | 844.133 |
| song_skip_rate | 0.000 | 0.251 | 0.501 | 0.751 | 1.000 | 0.501 | 0.289 |
| weekly_hours | 0.000 | 12.473 | 25.117 | 37.570 | 50.000 | 25.037 | 14.447 |
| weekly_songs_played | 3.000 | 127.000 | 251.000 | 375.000 | 499.000 | 250.824 | 143.328 |
| weekly_unique_songs | 3.000 | 76.000 | 150.000 | 225.000 | 299.000 | 150.783 | 85.795 |
The numeric predictors show well-centered distributions, with means and medians closely aligned across variables such as age, session length, and engagement metrics. No anomalies or extreme skews were detected, indicating stable data quality, while the negative values in signup_date simply reflect days since account creation rather than an error.
Table: Distribution of location

|    Category    | Count | Percentage (%) |
|:--------------:|:-----:|:--------------:|
|    Georgia     | 6705  |      5.4       |
|     Idaho      | 6697  |      5.4       |
|    Vermont     | 6676  |      5.3       |
|   California   | 6665  |      5.3       |
|   Washington   | 6638  |      5.3       |
|   New Jersey   | 6634  |      5.3       |
|   Nebrasksa    | 6601  |      5.3       |
| North Carolina | 6583  |      5.3       |
|  North Dakota  | 6577  |      5.3       |
|      Utah      | 6577  |      5.3       |
|    New York    | 6574  |      5.3       |
|    Alabama     | 6555  |      5.2       |
|   Wisconsin    | 6553  |      5.2       |
|    Virginia    | 6541  |      5.2       |
| South Carolina | 6534  |      5.2       |
|     Maine      | 6523  |      5.2       |
| West Virginia  | 6486  |      5.2       |
|    Florida     | 6480  |      5.2       |
|    Montana     | 6401  |      5.1       |


Table: Distribution of payment_plan

| Category | Count | Percentage (%) |
|:--------:|:-----:|:--------------:|
| Monthly  | 62562 |       50       |
|  Yearly  | 62438 |       50       |


Table: Distribution of payment_method

|  Category   | Count | Percentage (%) |
|:-----------:|:-----:|:--------------:|
| Debit Card  | 31292 |       25       |
|   Paypal    | 31282 |       25       |
|  Apple Pay  | 31213 |       25       |
| Credit Card | 31213 |       25       |


Table: Distribution of customer_service_inquiries

| Category | Count | Percentage (%) |
|:--------:|:-----:|:--------------:|
|   Low    | 41873 |      33.5      |
|   High   | 41583 |      33.3      |
|  Medium  | 41544 |      33.2      |
--- location vs Churned ---

                    0    1
  Alabama        3209 3346
  California     3240 3425
  Florida        3187 3293
  Georgia        3208 3497
  Idaho          3273 3424
  Maine          3227 3296
  Montana        3121 3280
  Nebrasksa      3215 3386
  New Jersey     3205 3429
  New York       3217 3357
  North Carolina 3203 3380
  North Dakota   3183 3394
  South Carolina 3159 3375
  Utah           3191 3386
  Vermont        3234 3442
  Virginia       3233 3308
  Washington     3204 3434
  West Virginia  3153 3333
  Wisconsin      3164 3389

--- payment_plan vs Churned ---

              0     1
  Monthly 30401 32161
  Yearly  30425 32013

--- payment_method vs Churned ---

                  0     1
  Apple Pay   15015 16198
  Credit Card 15355 15858
  Debit Card  15177 16115
  Paypal      15279 16003

--- customer_service_inquiries vs Churned ---

             0     1
  High   10673 30910
  Low    29762 12111
  Medium 20391 21153
The categorical predictors show balanced distributions across location, payment plan, and payment method, indicating no single category dominates the customer base. However, customer service inquiries stand out: churn is concentrated among those with high inquiry levels (74%), suggesting that service-related friction is a key churn driver. This finding directs visualization efforts toward customer service interactions, while maintaining comparisons across payment and regional segments to confirm whether churn patterns remain consistent.
To understand how each numeric predictors spread relative ot its average, the coefficient of variation (CV) has been computed. Unlike plain standard deviation, CV is scale-free which enables comparing variability across different metrics even if they’re on different scales. This measure helps stakeholders see where customers differ the most, not just where the numbers of big.
# A tibble: 12 × 2
   variable                    cv
   <chr>                    <dbl>
 1 num_subscription_pauses  0.712
 2 notifications_clicked    0.59
 3 num_favorite_artists     0.59
 4 num_shared_playlists     0.589
 5 num_platform_friends     0.578
 6 weekly_hours             0.577
 7 song_skip_rate           0.576
 8 weekly_songs_played      0.571
 9 average_session_length   0.569
10 weekly_unique_songs      0.569
11 age                      0.37
12 signup_date             -0.578
Variables with high CV highlight where customers differ the most. User frequency in pausing subscriptions as measured by num_subscription_pauses show the highest variability. It implies that some customers rarely pause their subscription, while others pause frequently. Other variables with high CV can be roughly bucketed as in-app behaviors of the users as denoted by variables such as notifications_clicked, num_favorite_artists, num_shared_playlists, and so on consistently show high variation. This points to suggest that highly engaged users versus customers who barely use these features.
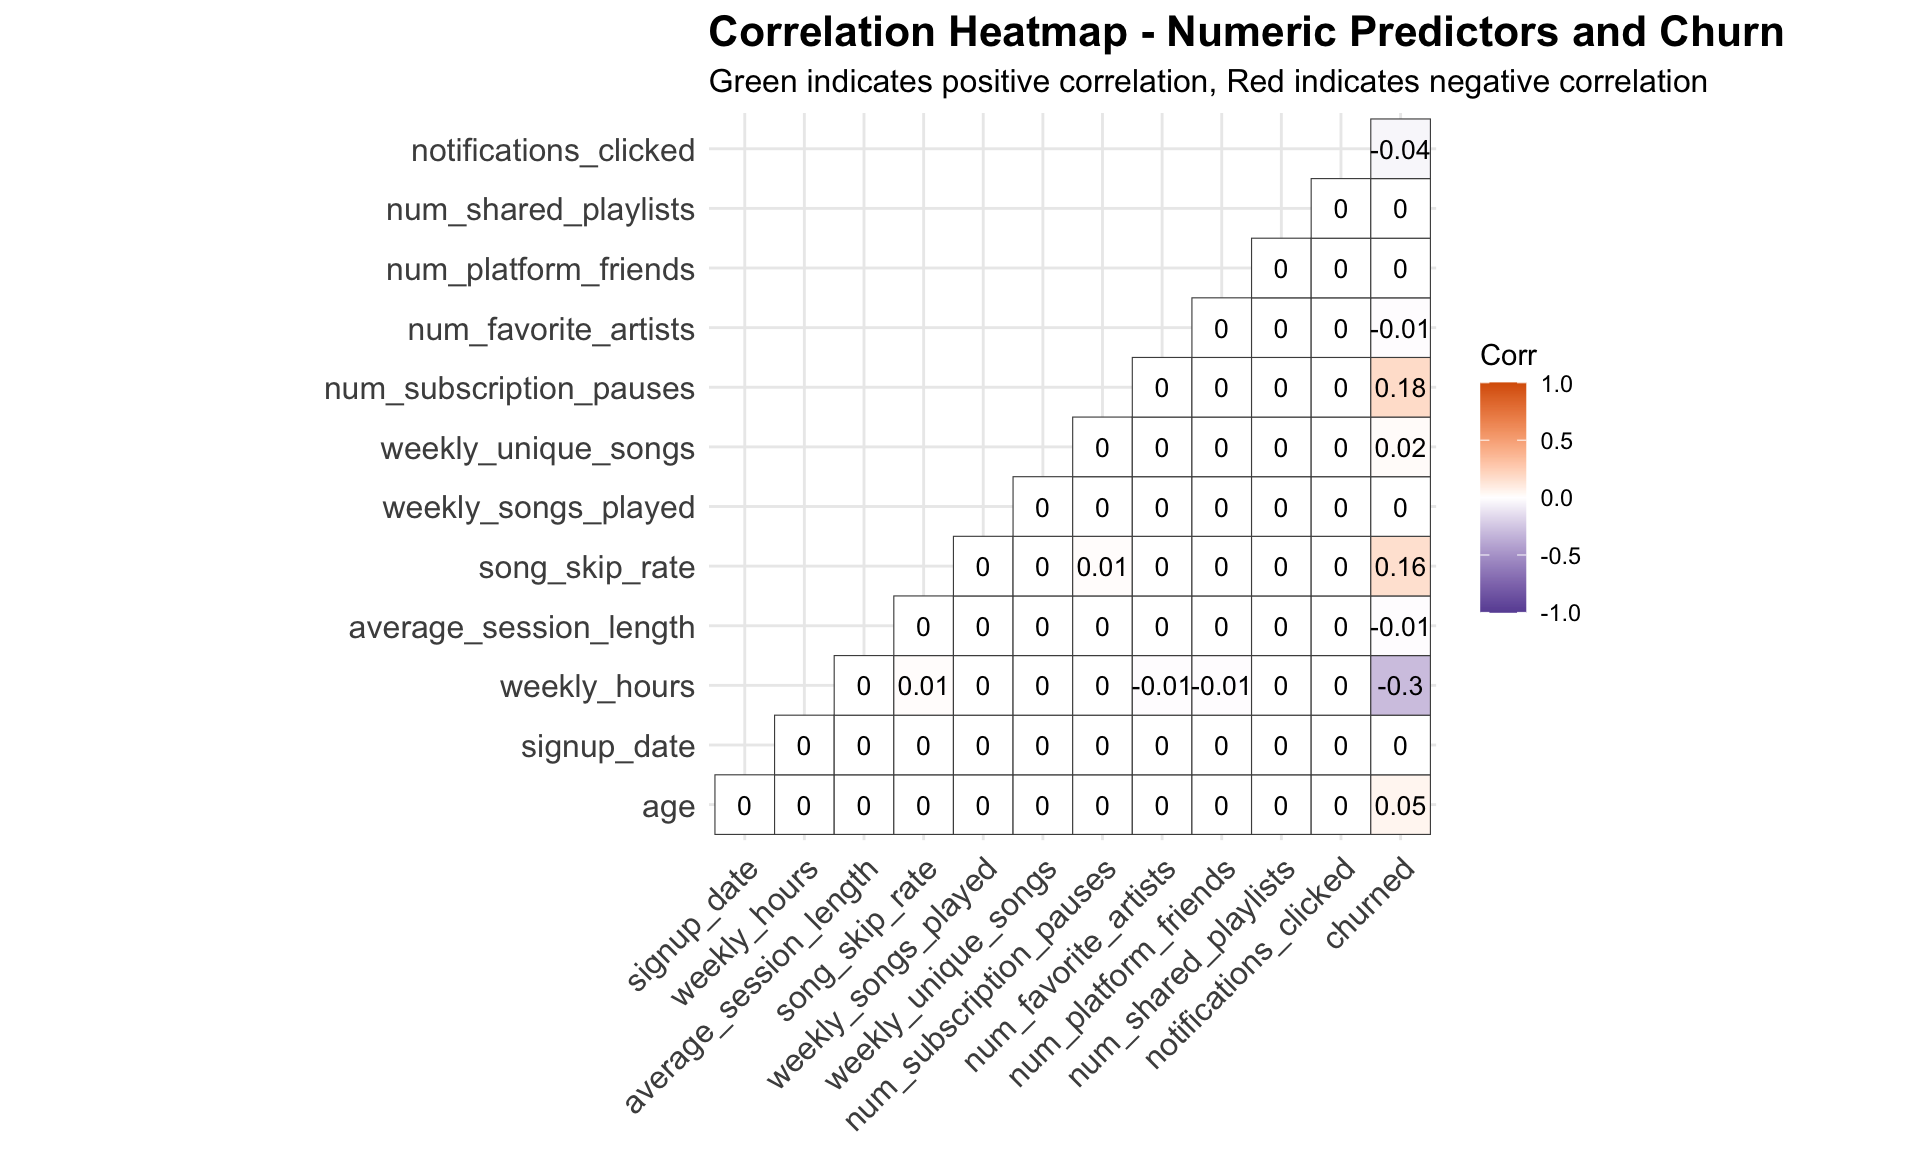
The correlation analysis shows which customer behaviors move together with churn. Most variables have weak correlations, meaning no single metric alone explains why customers leave. However, higher skip-rates (+0.16) and frequent subscription pauses (+0.18) are modestly linked to churn, while higher weekly hours (-0.3) appear linked to retention. These signals suggest that disengagement patterns, rather than demographics or platform activity counts, are stronger early signs for churns.
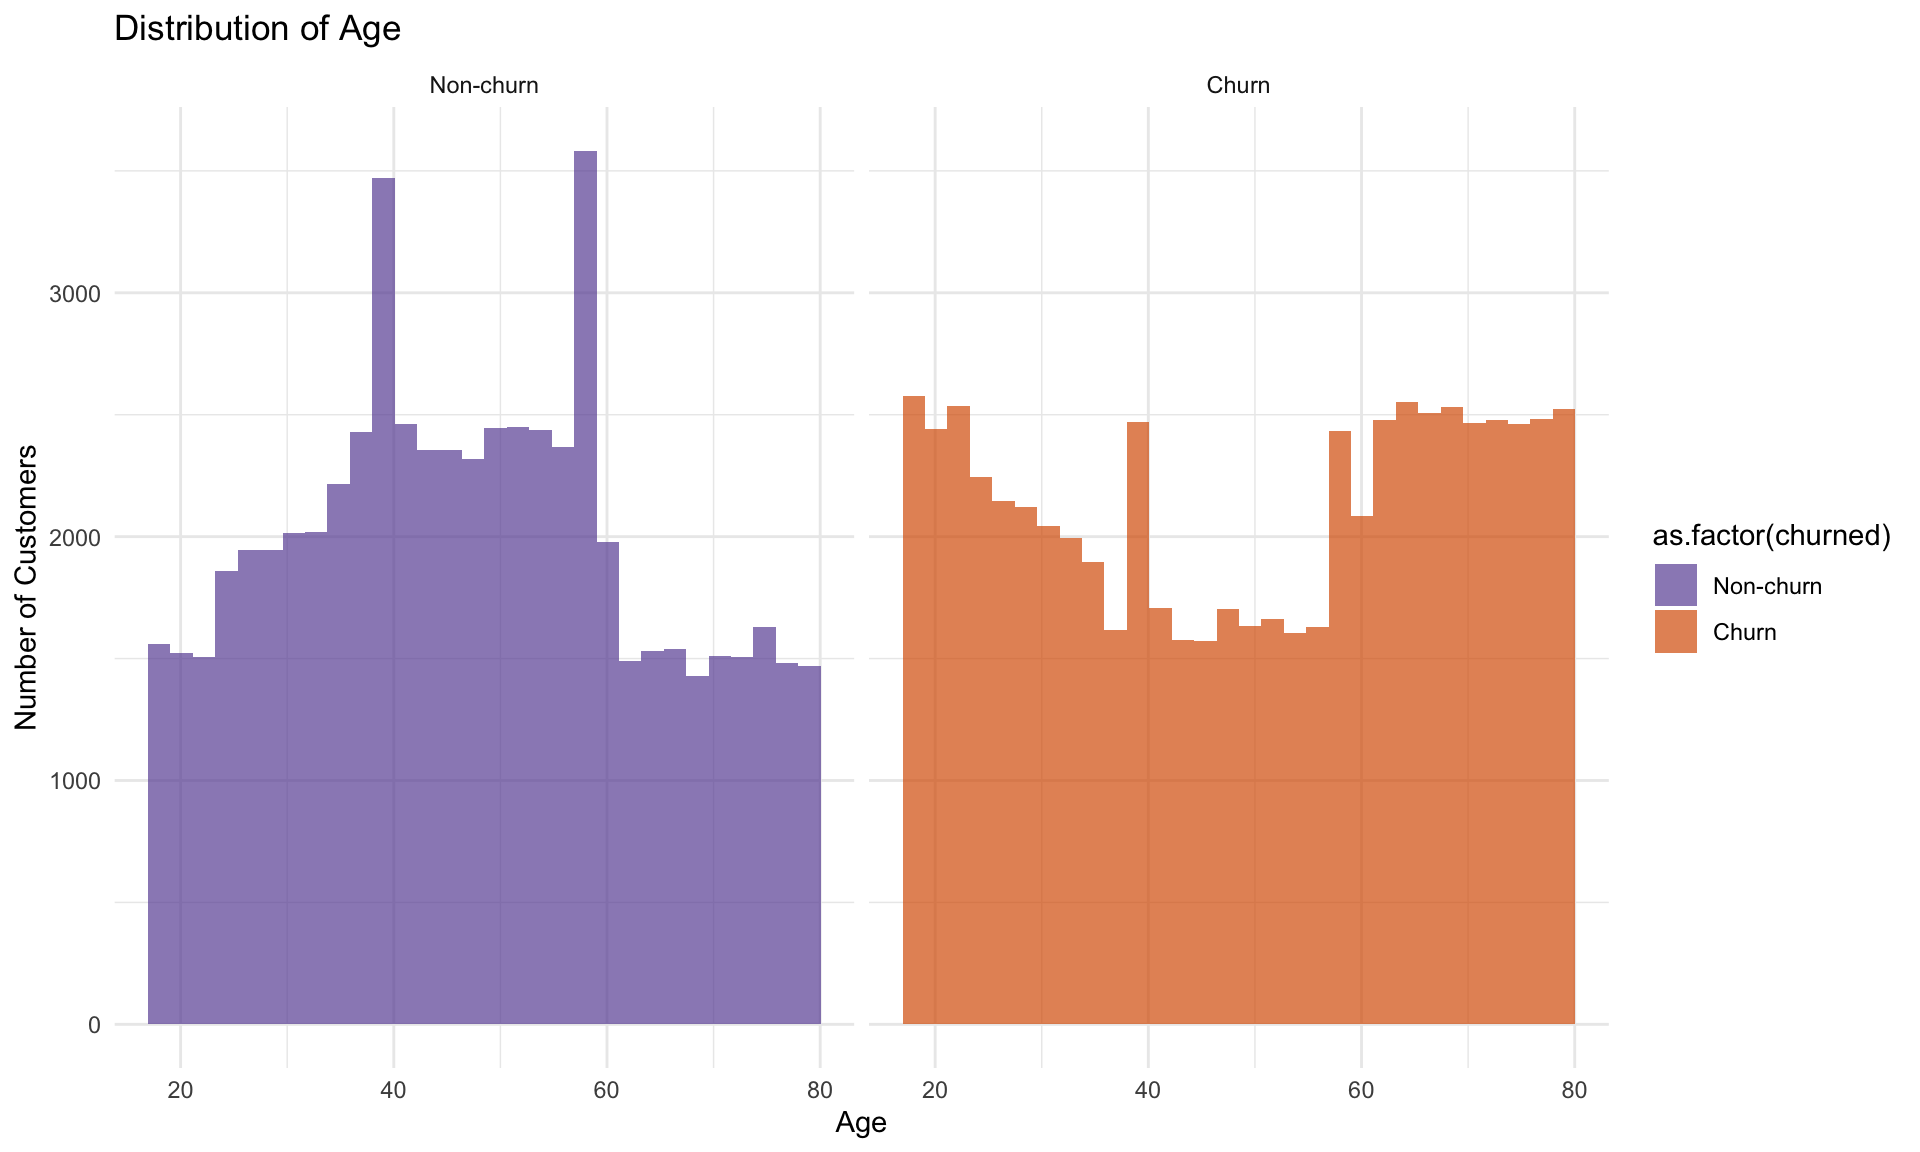

Observing the histogram, churn and non-churn customers flatten across ages 25-60, showing no standout demographic in the middle ranges. The density plot, however, highlights that churn spikes at the edge with both younger (<25) and older (>60 ) groups are more prone to leave.
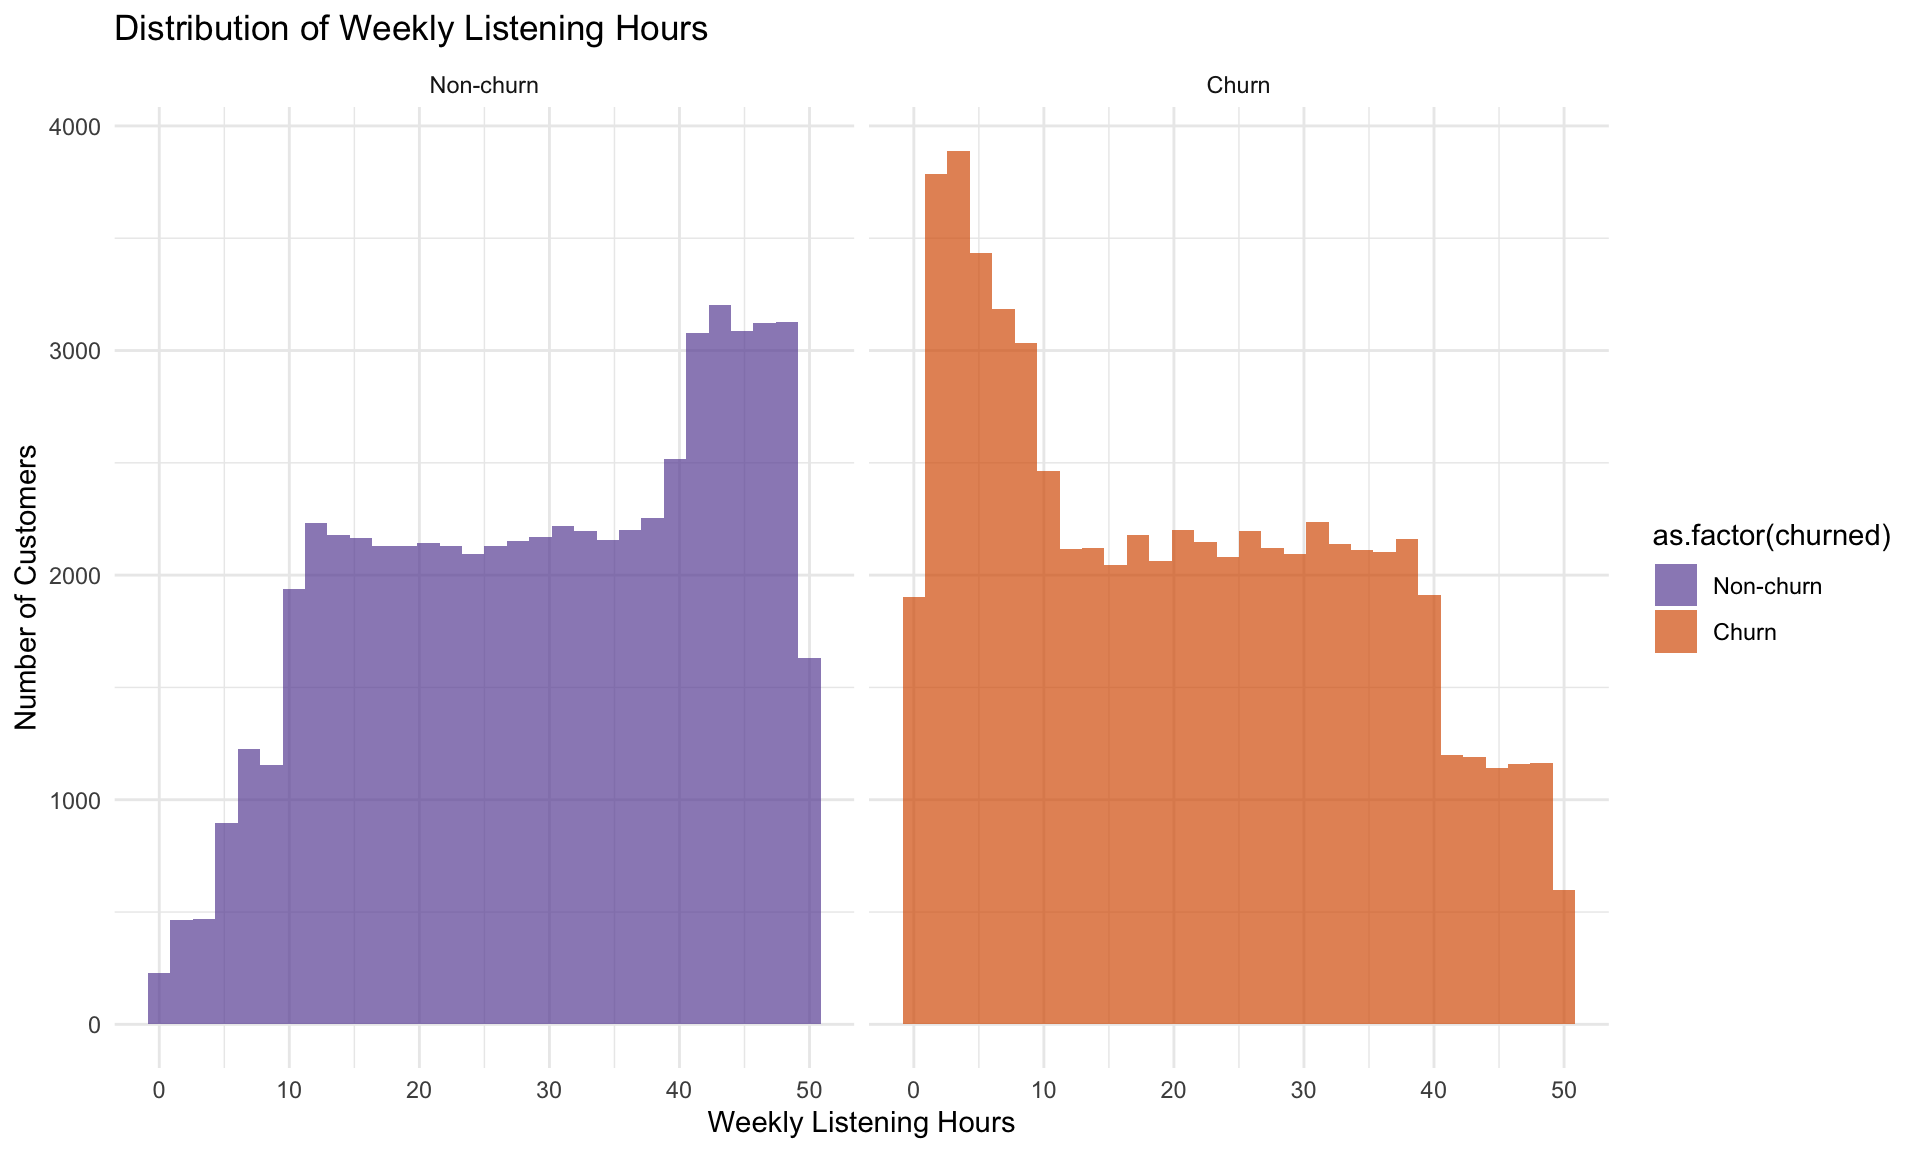
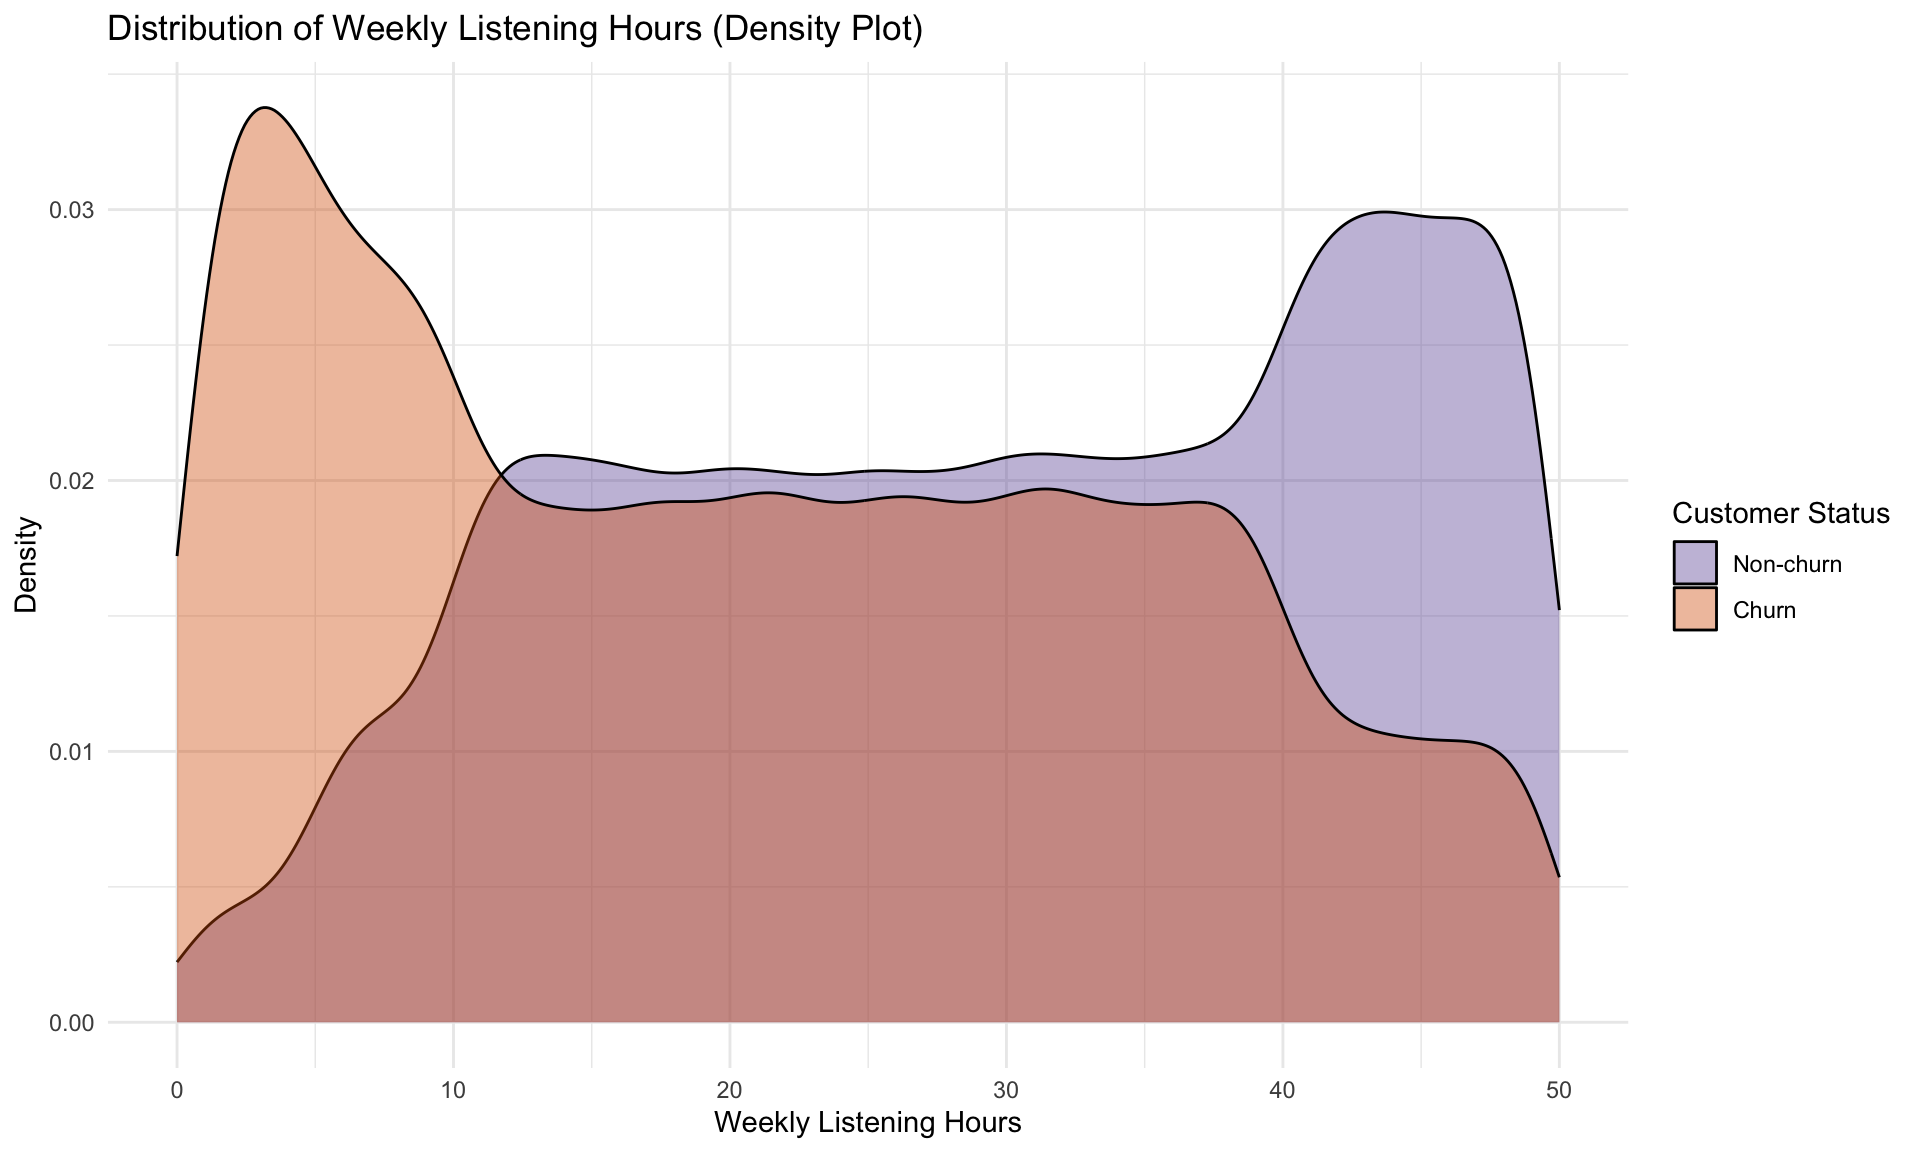
From the histogram, churned customers are clustered at the lower end (0-10 hours), while non-churns extend into higher listening ranges. The density plot reinforces this by showing churn density peaking in low engagment bands, while non-churns dominate the 30-50 hour range.
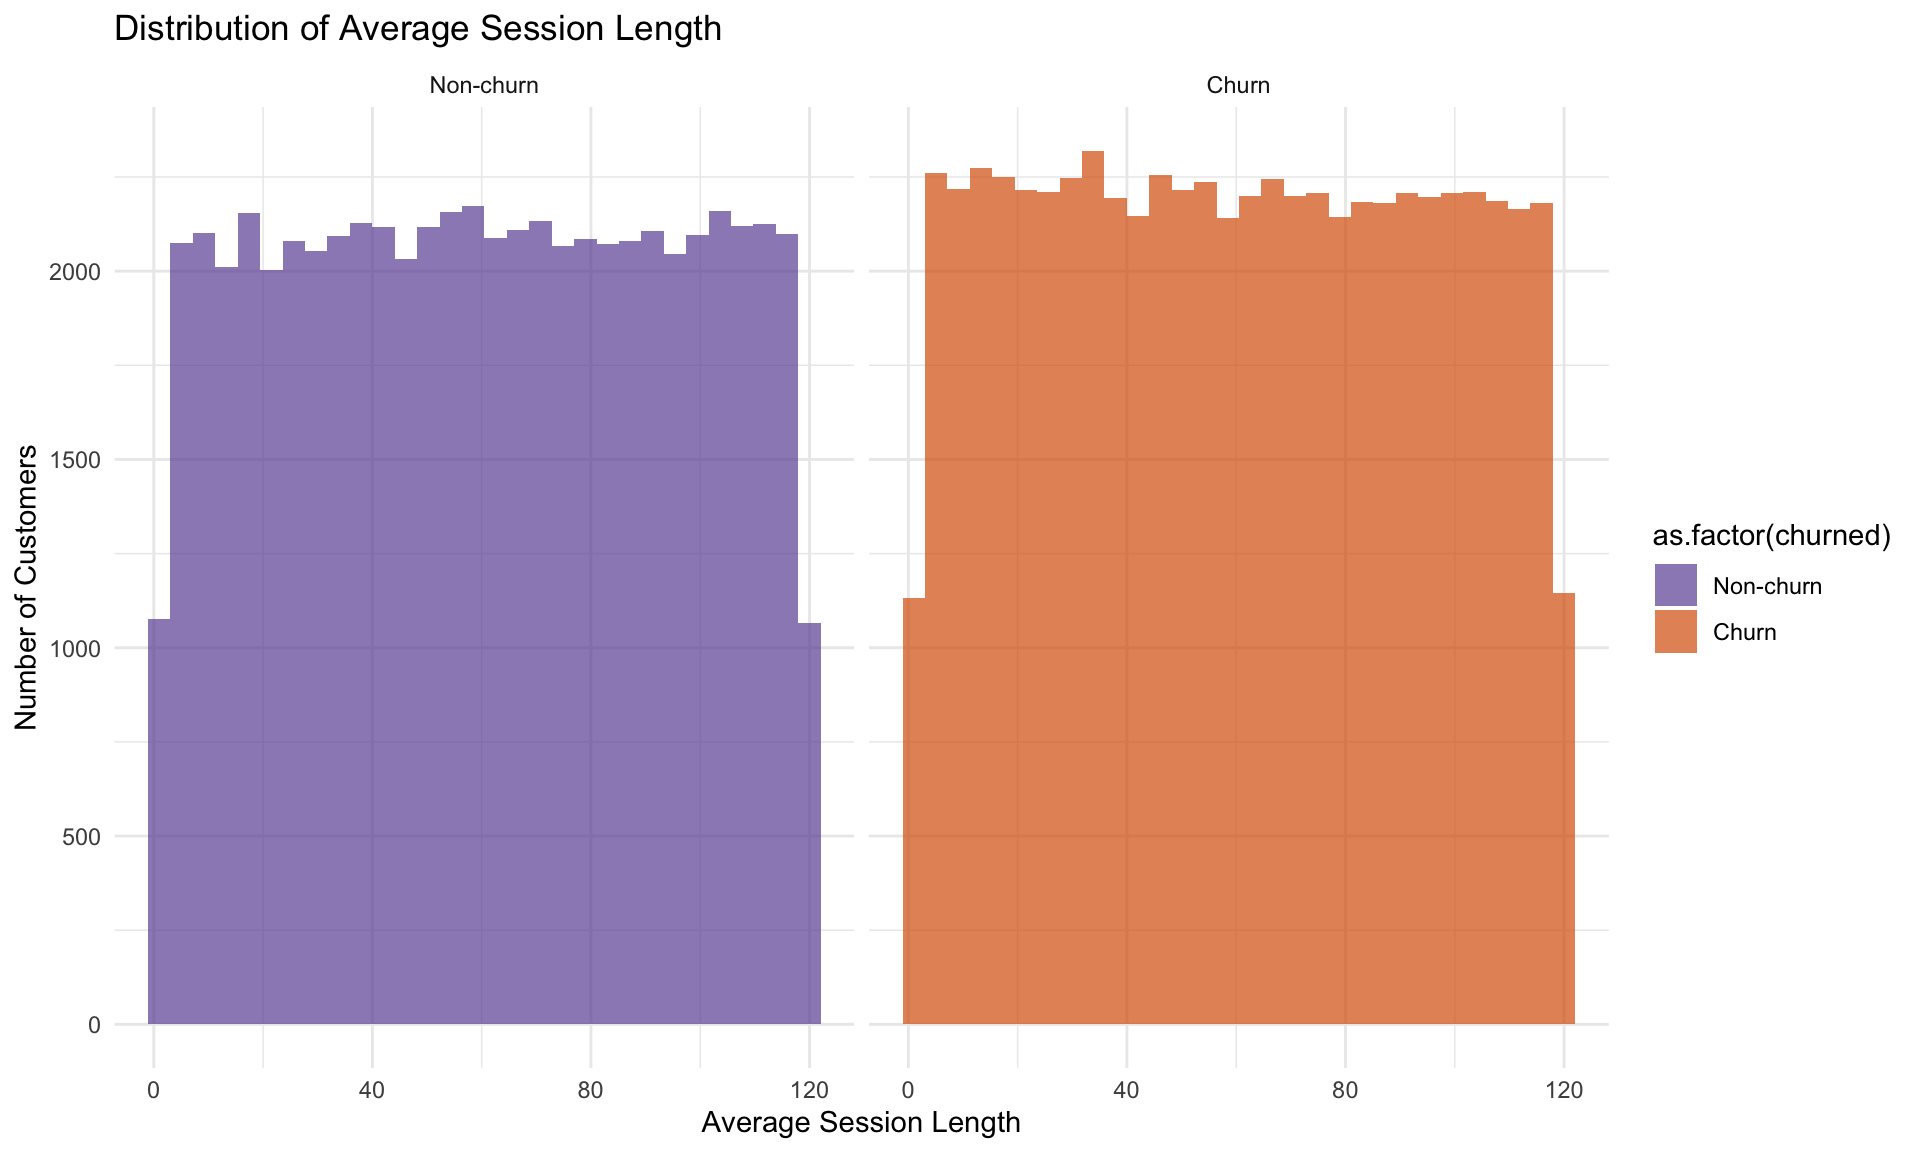

Both the histogram and density plot show relatively flat, overlapping distributions for chrun and non-churn, suggesting session duration does not distinguish customer churn behavior.
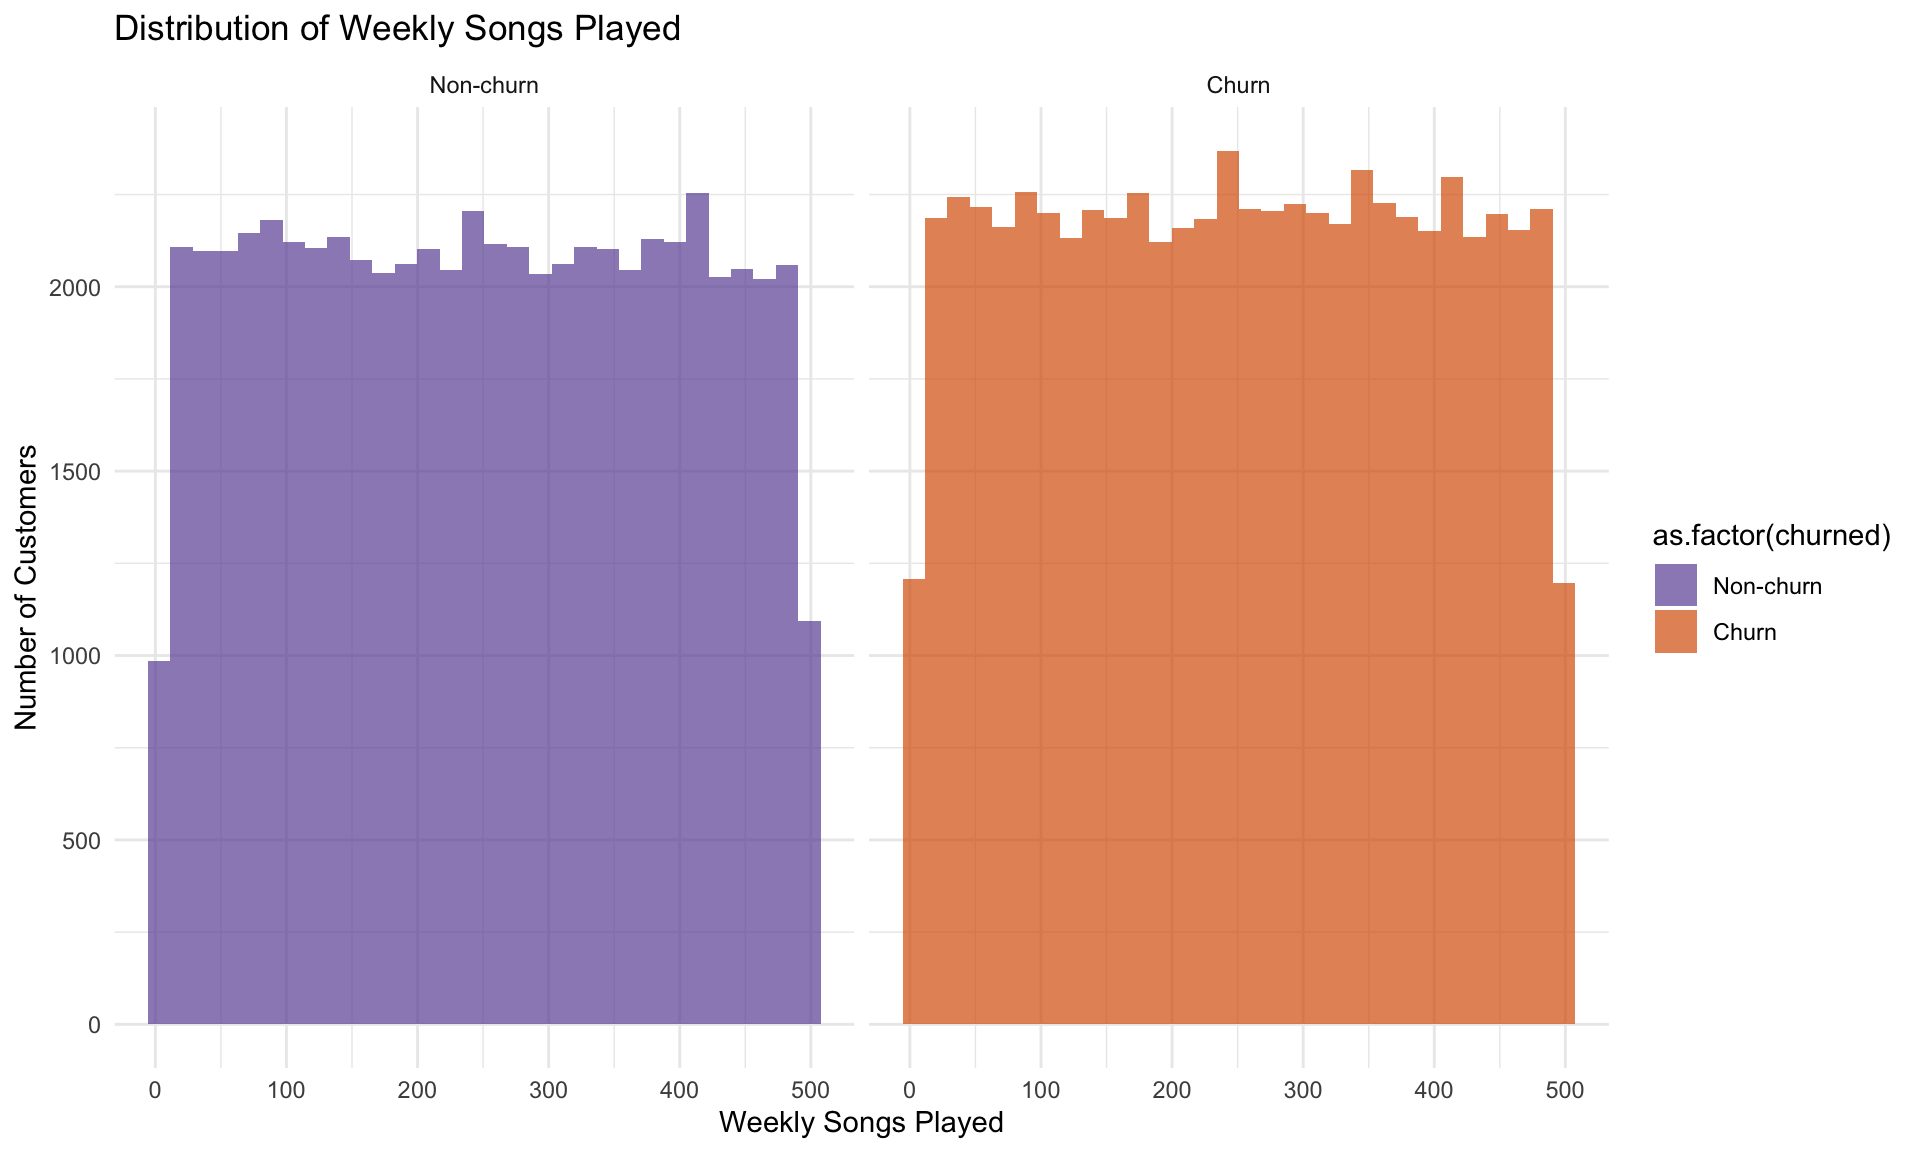
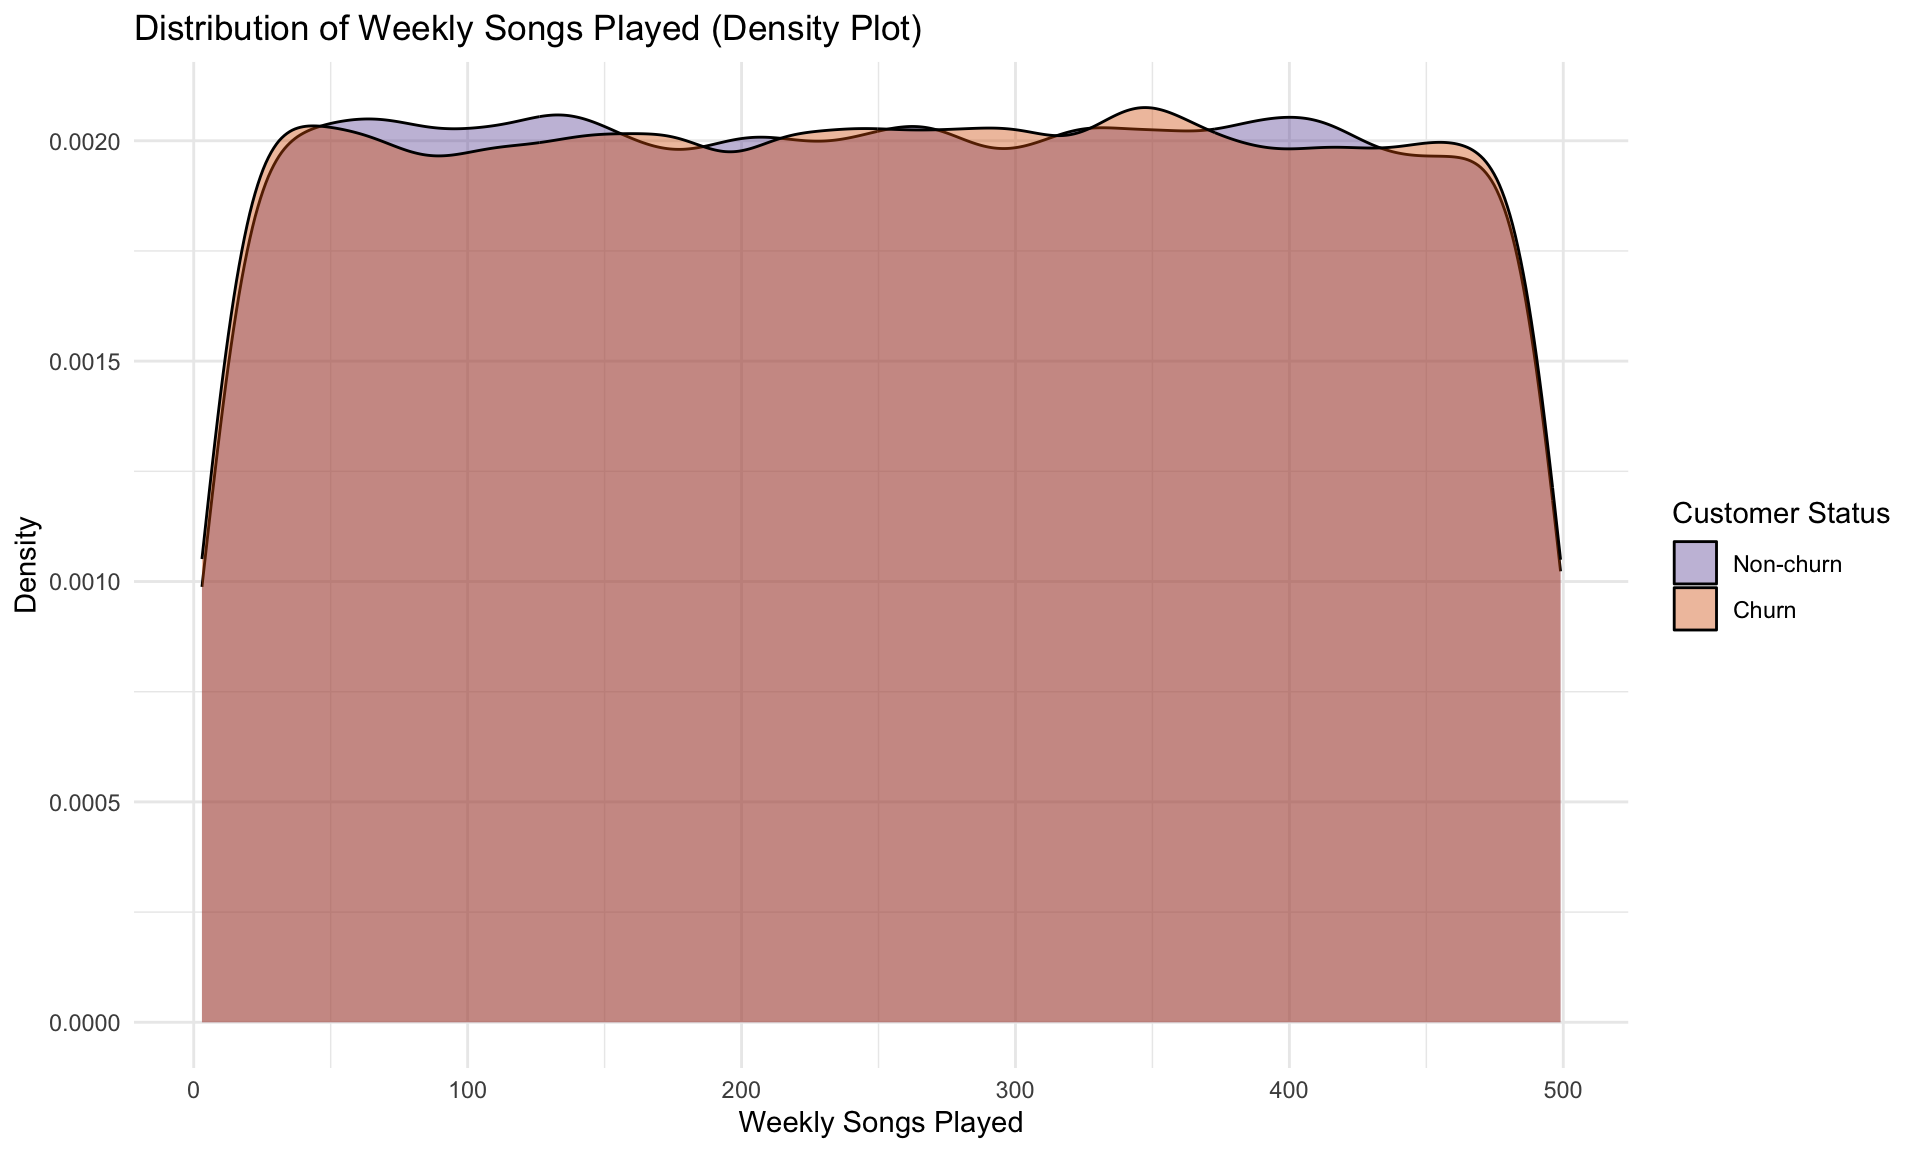
Histogram shows even, flat patterns for both churned and non-churned customers. The density plot confirms little separation, meaning the total number of songs played weekly has limited impact on churn behavior.
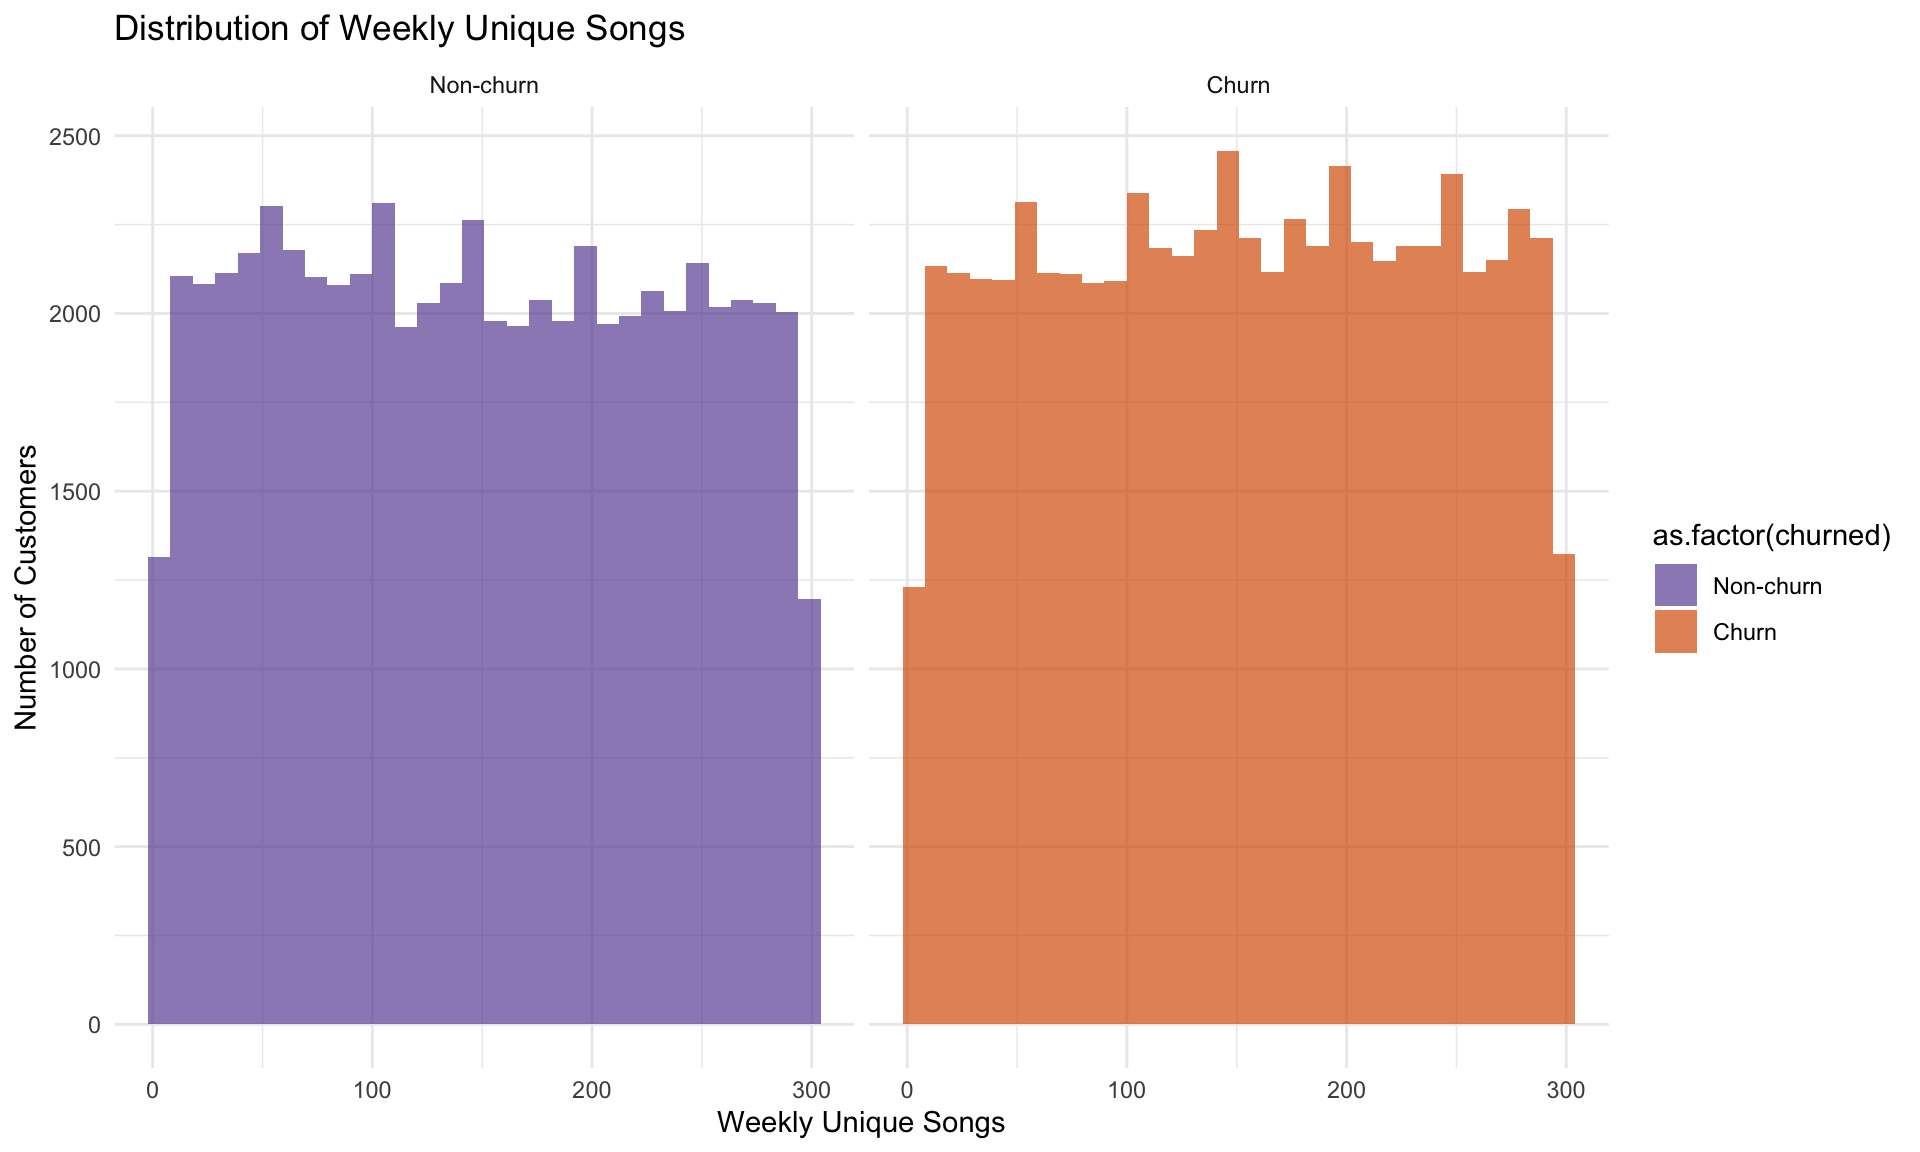
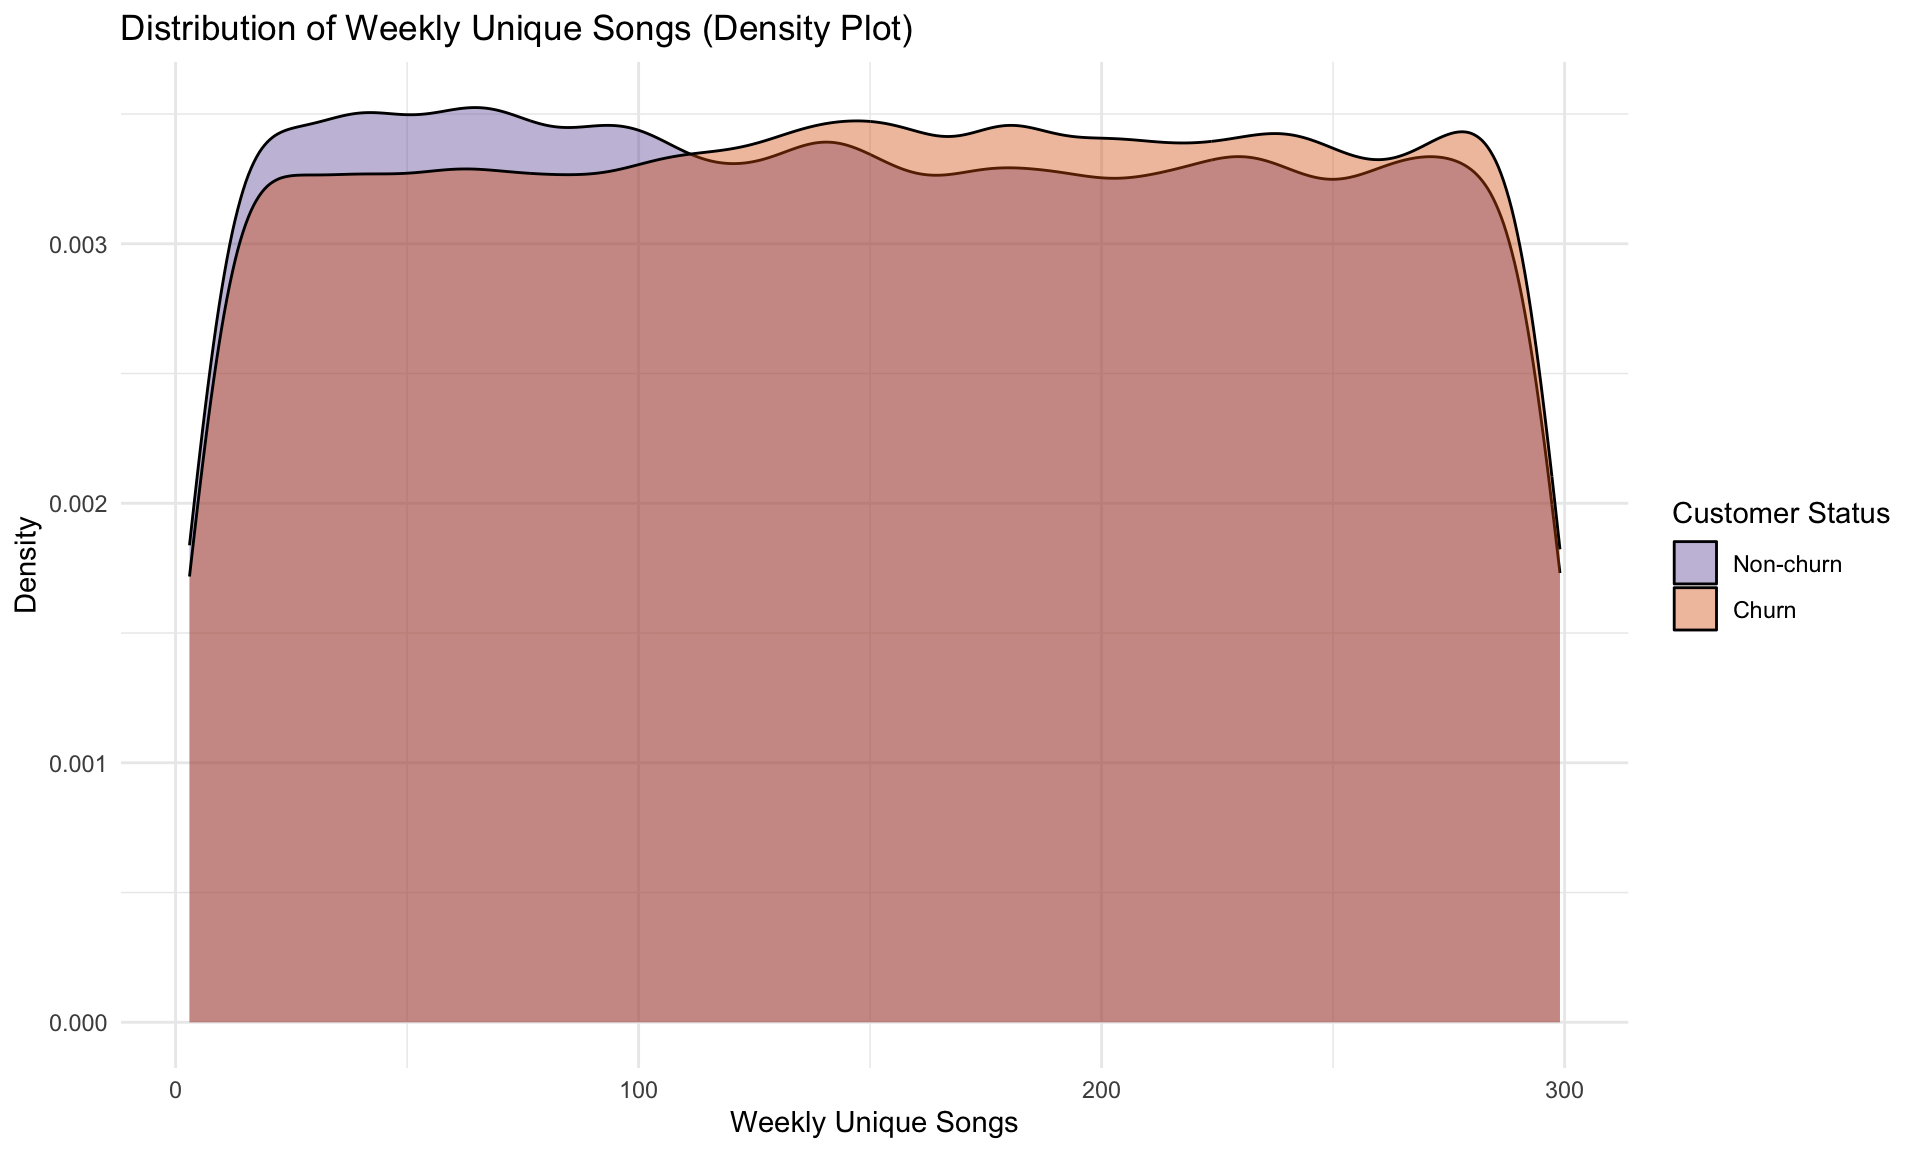
While the histogram appears flat, the density plot indicates churned customers lean toward fewer unique groups, signaling that limited variety in music choices may be linked to higher churn risk.
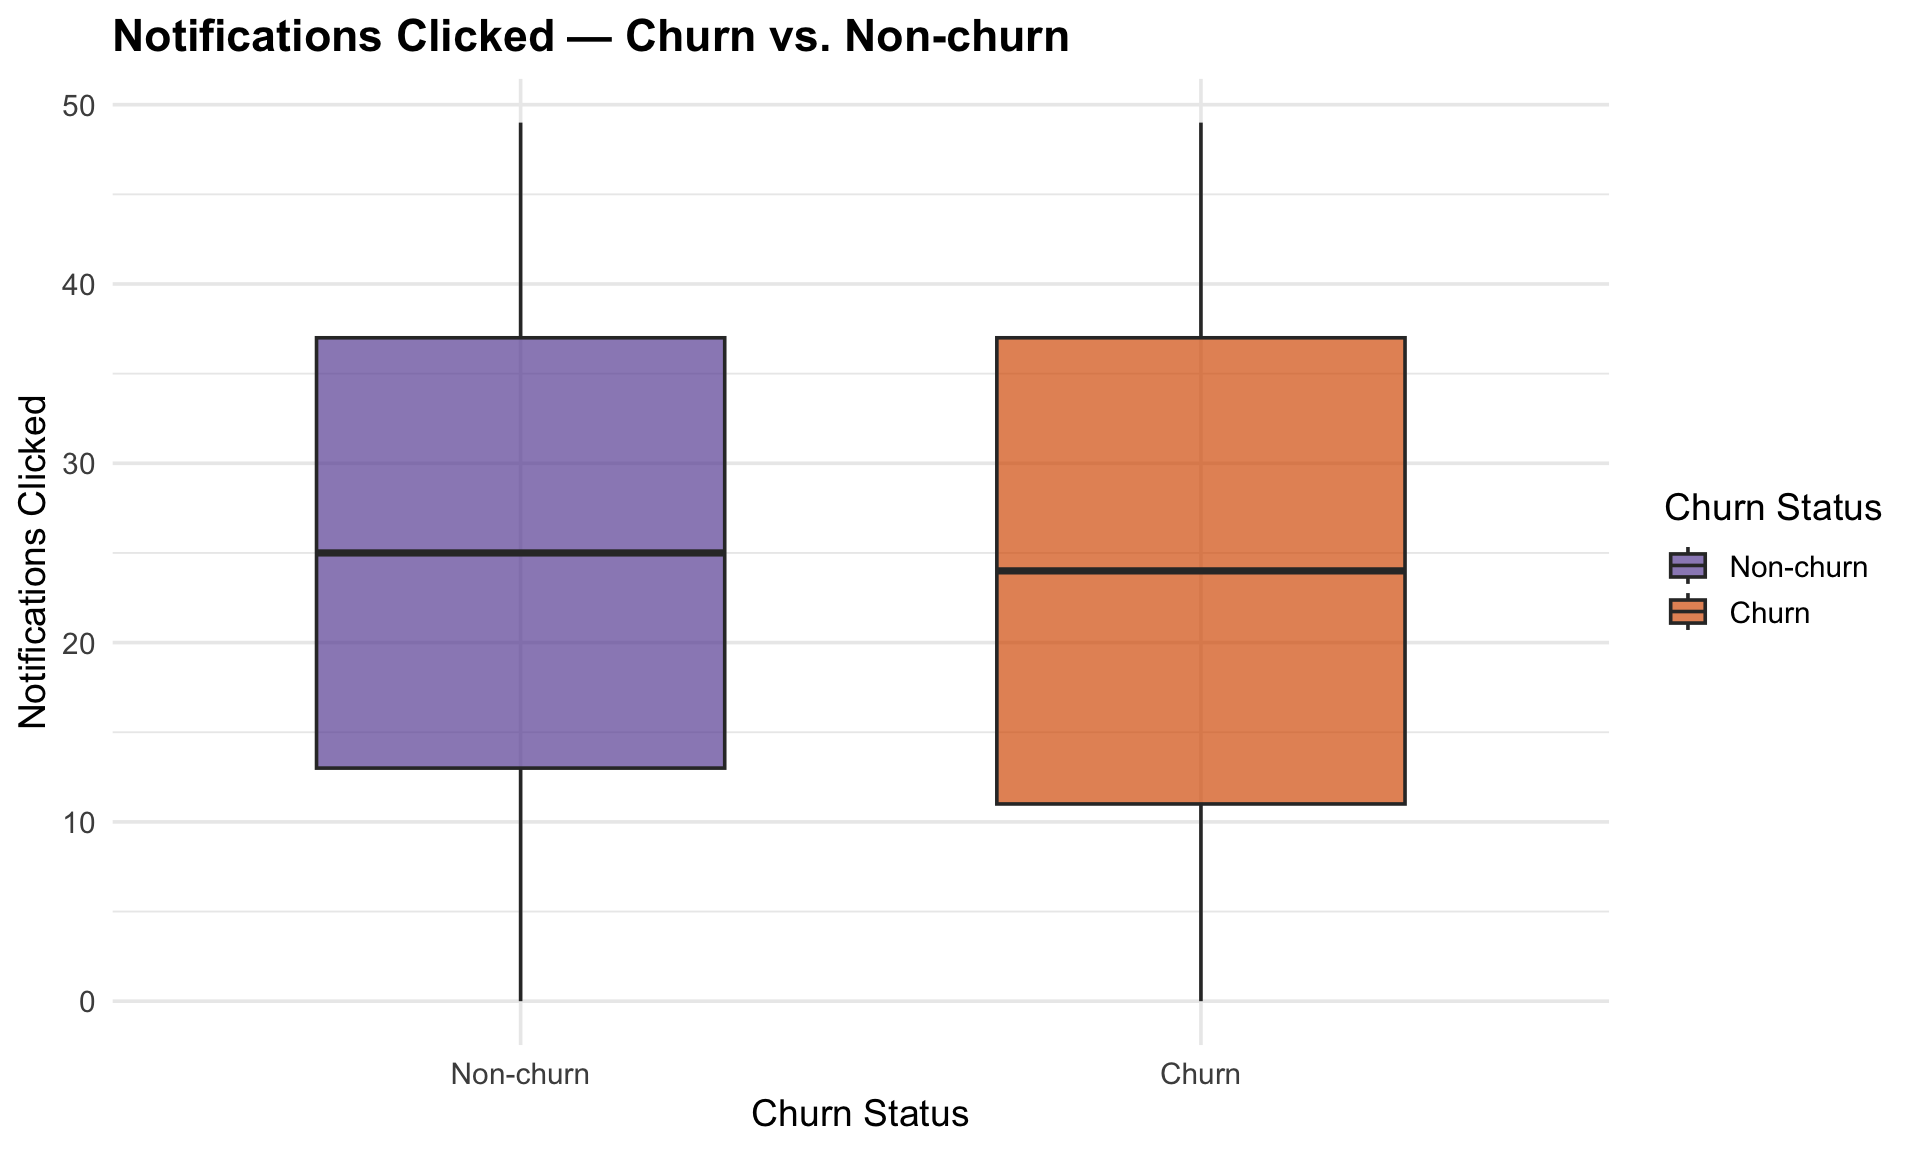
Both churned and non-churned customers interact with notifications at similar levels, though churned users show a slightly lower minimum engagement.
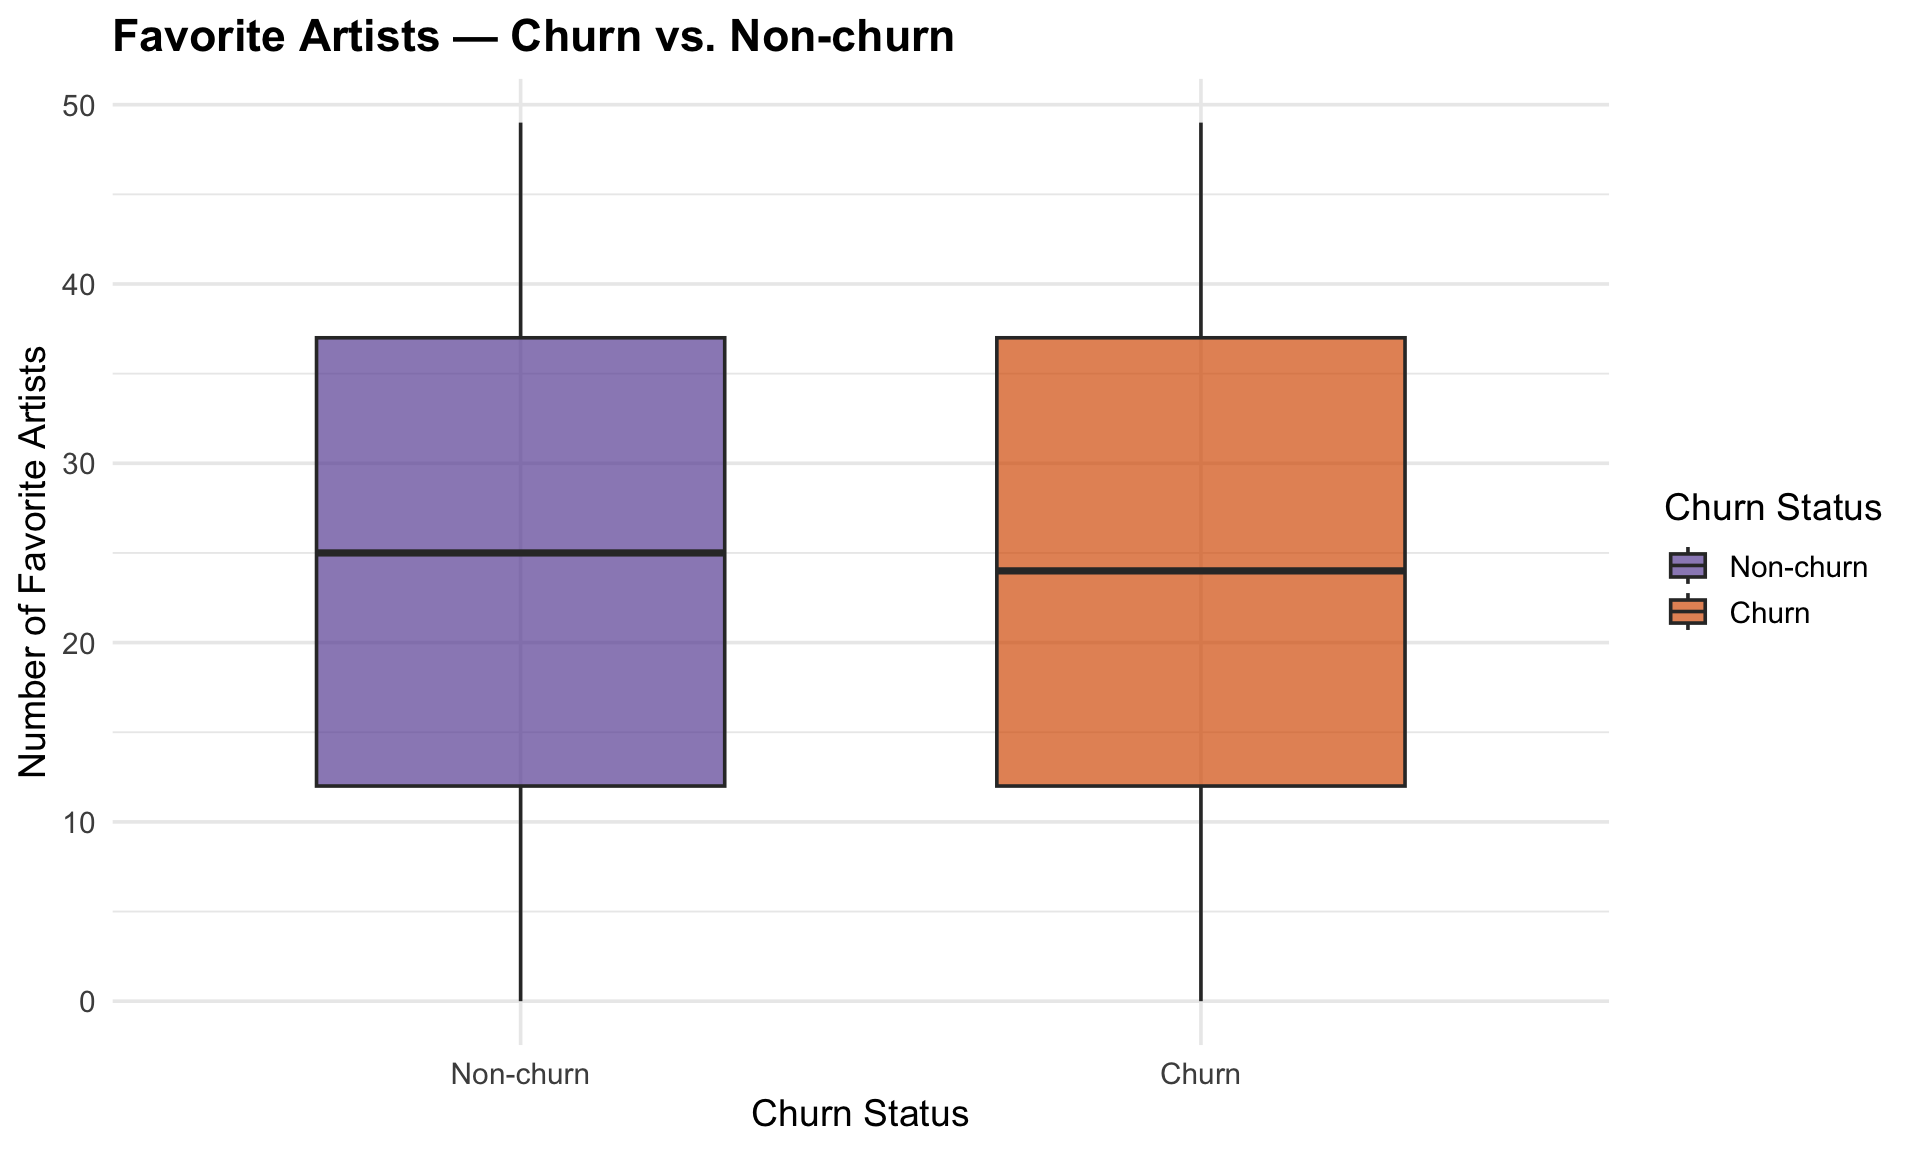
The number of favorite artists is balanced across churned and non-churned groups, indicating this factor does not strongly influence churn.
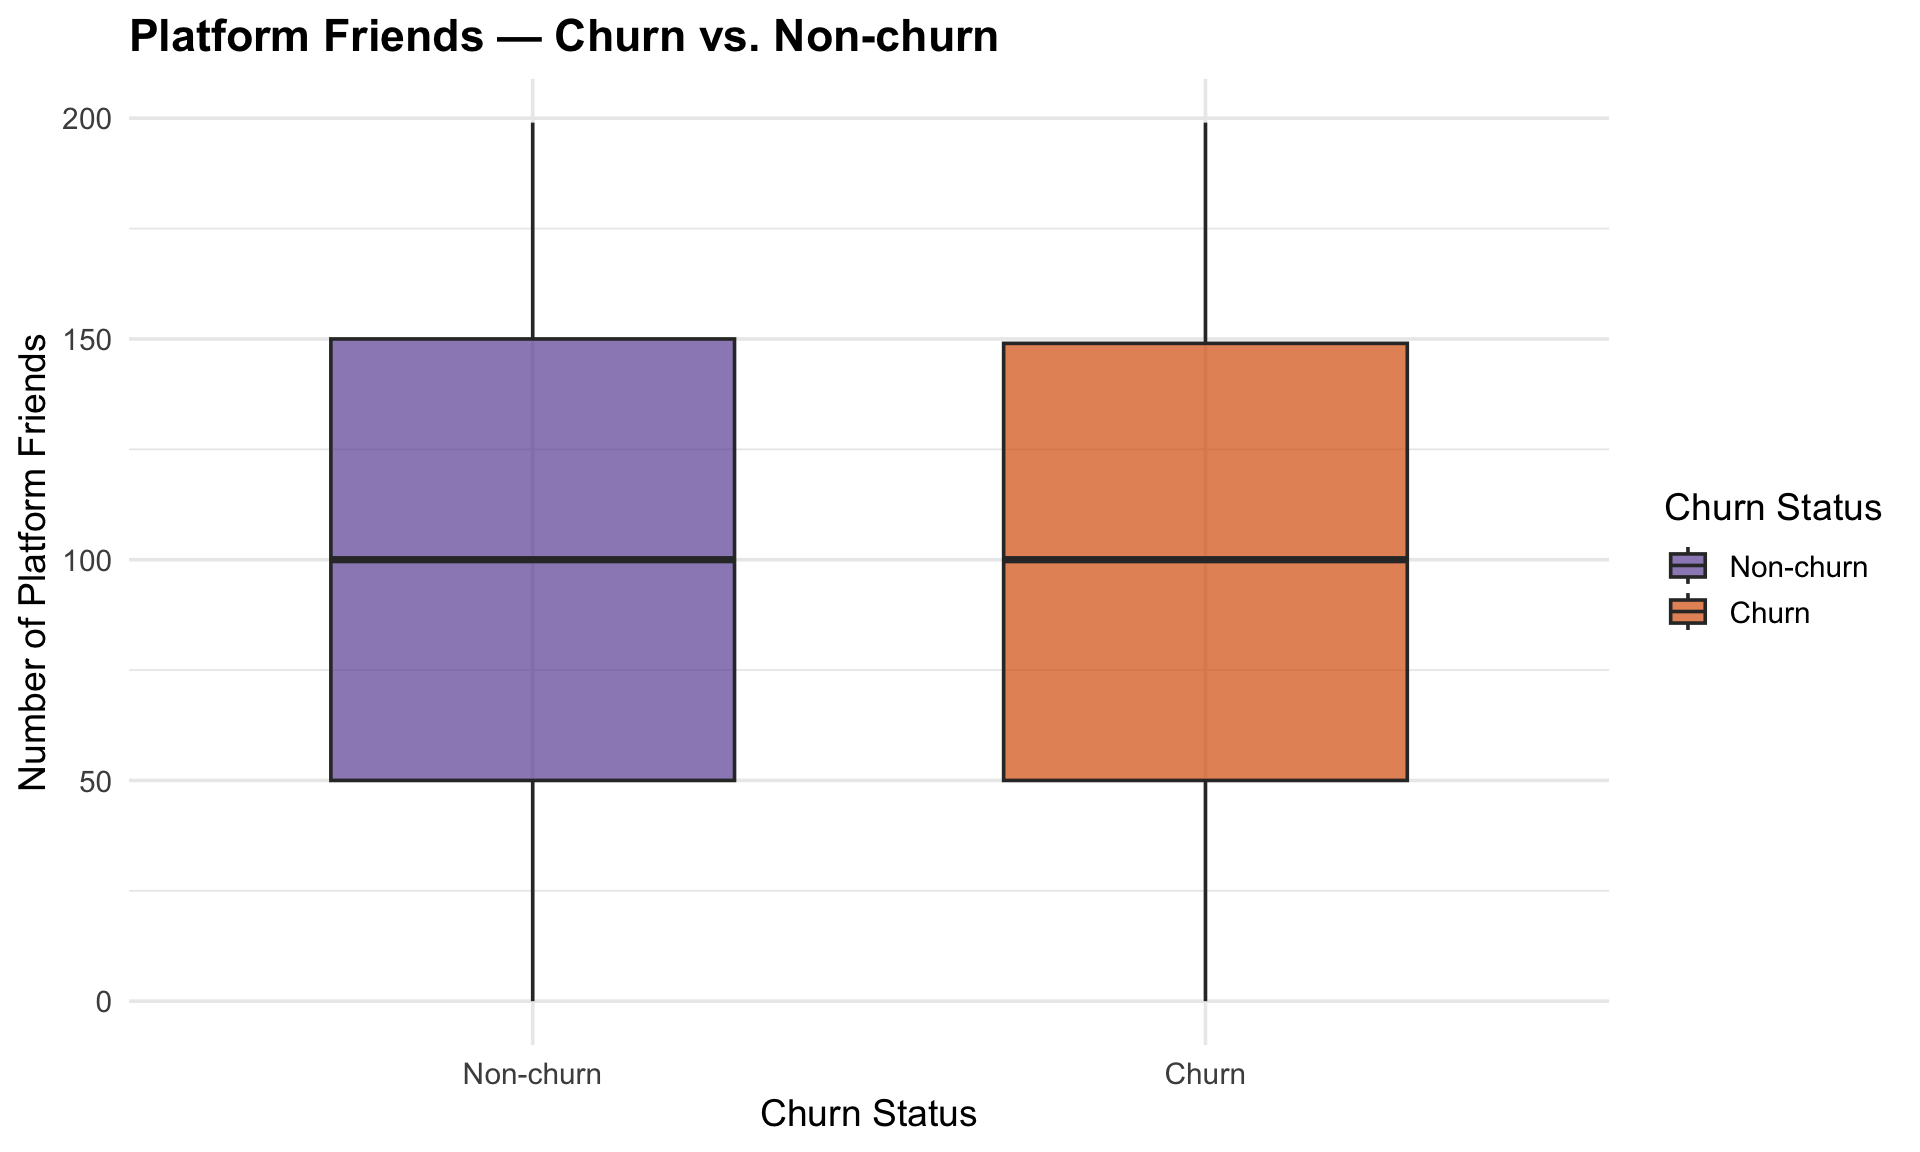
Customers, whether chruned or not, average around 100 friends on the platform, suggesting social connections alone does not drive churn.
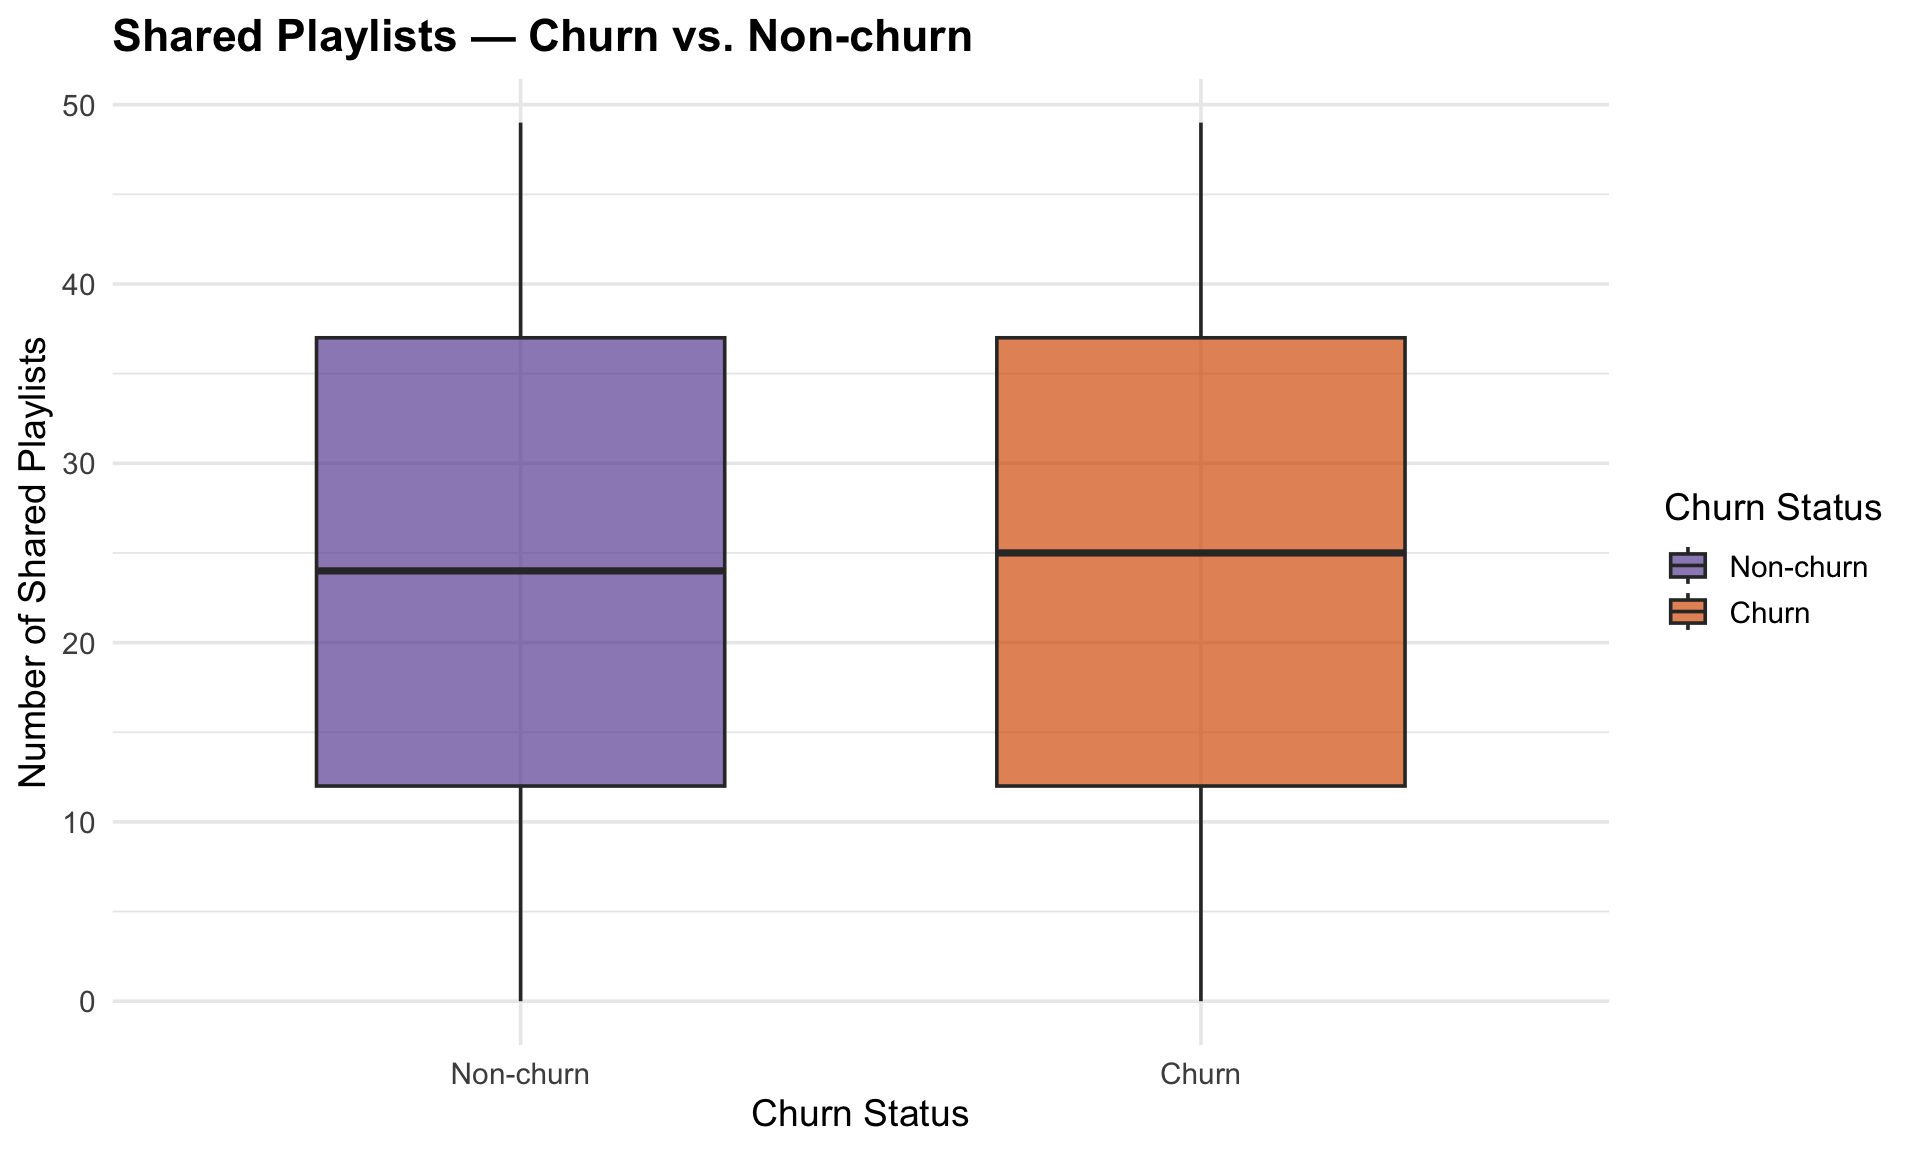
Churn and non-churn customers both maintain about 25 shared playlists on average, showing minimal difference in playlist-sharing behavior.
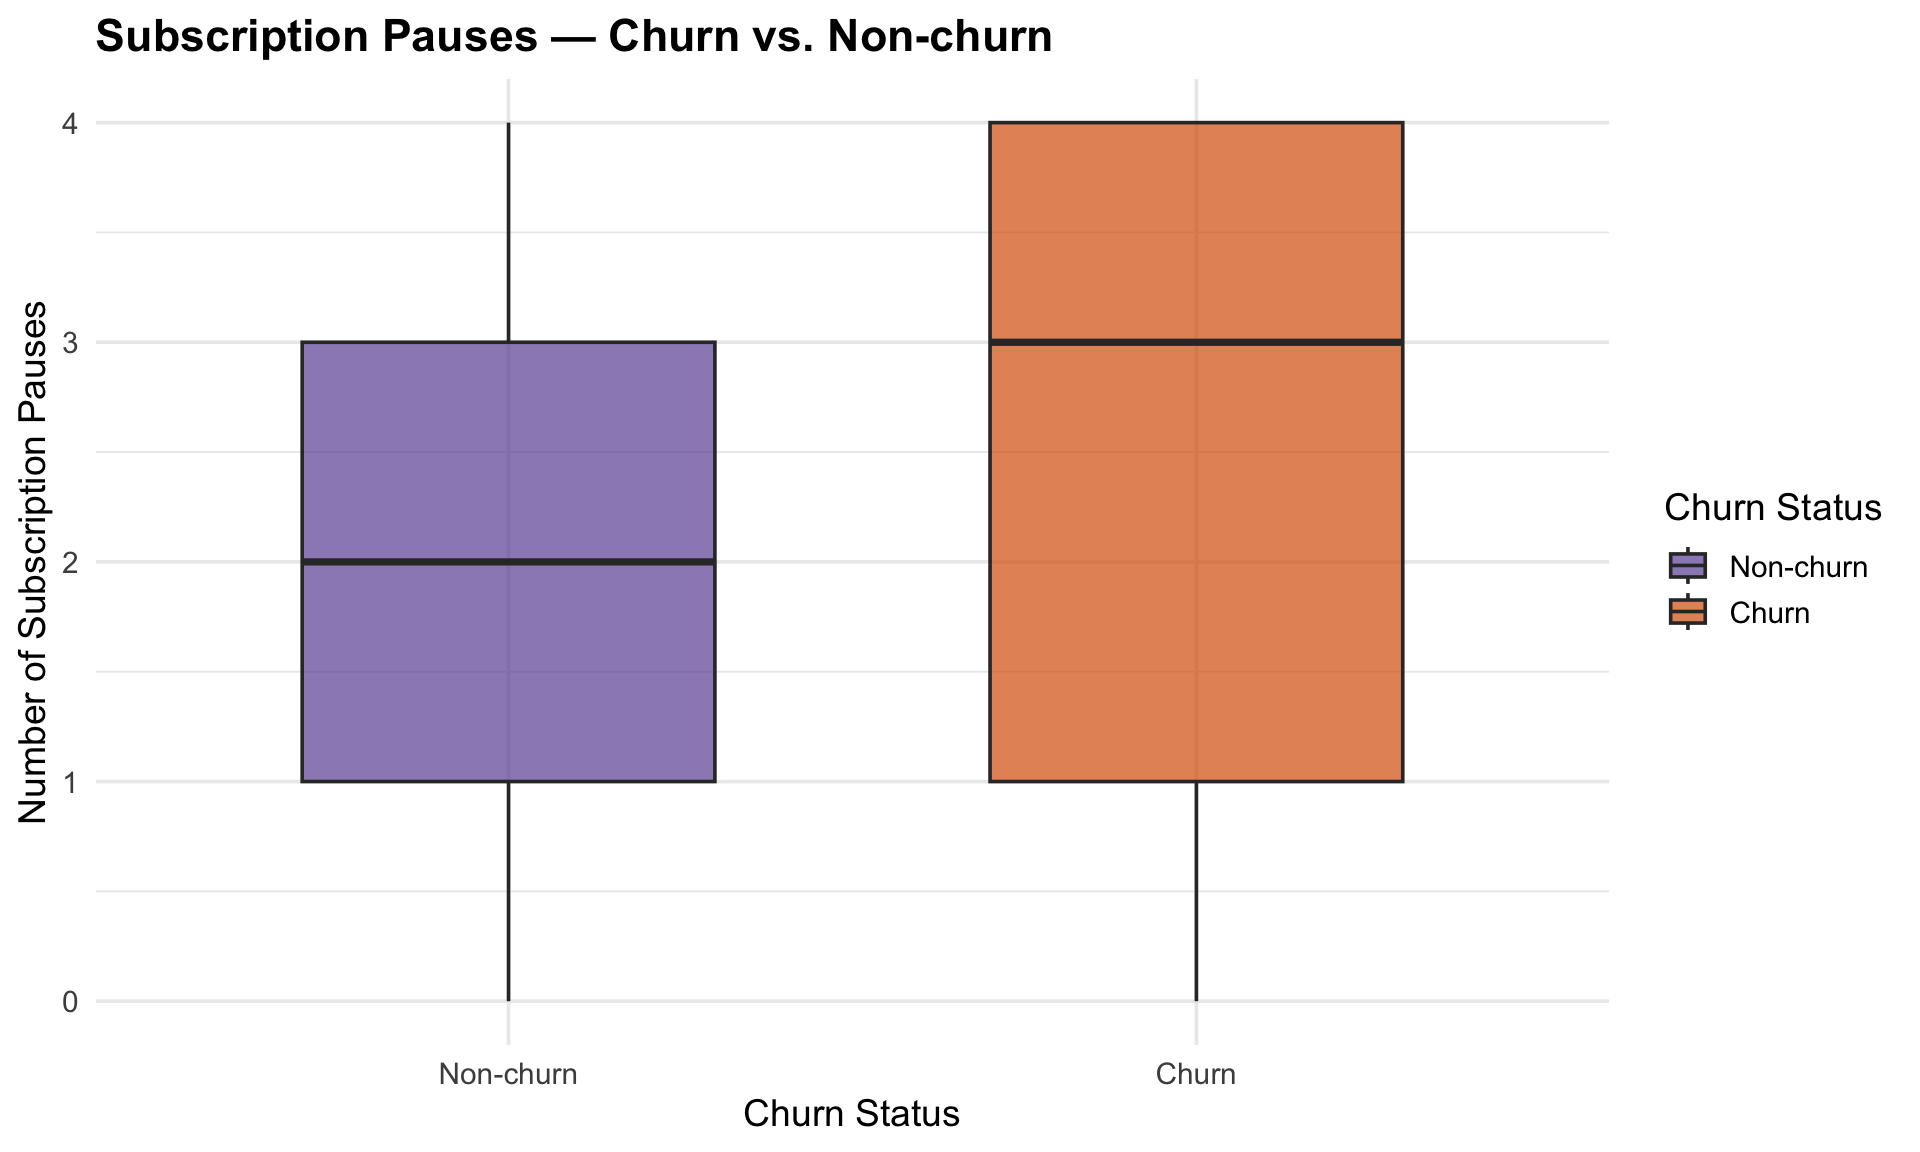
A clear difference emerges here as churned customers average three subscription pauses versus two for non-curned, signaling that repeated interruptions are an important churn marker.
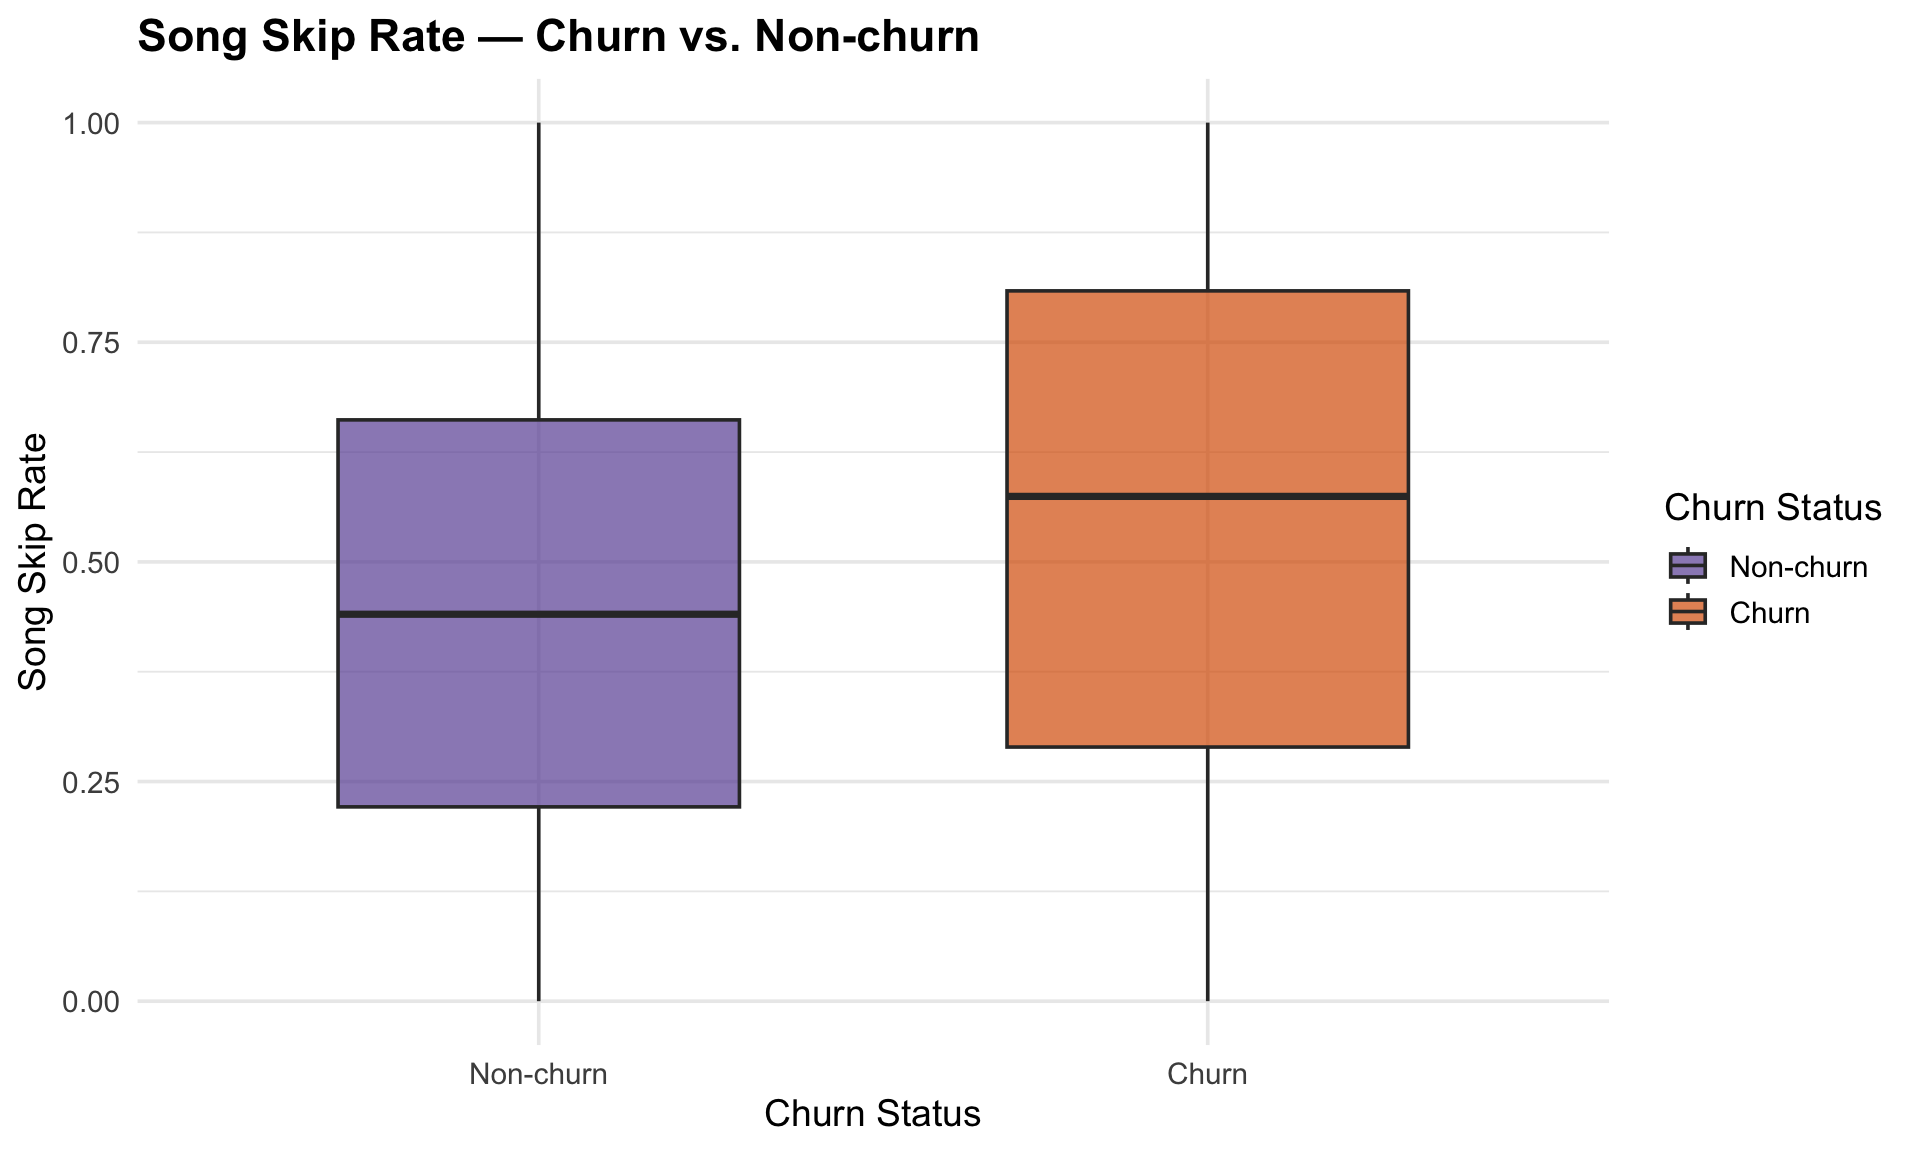
Churned customers display a higher skip rate, pointing to dissatisfcation with music recommendations and potential misalignment with user preferences.
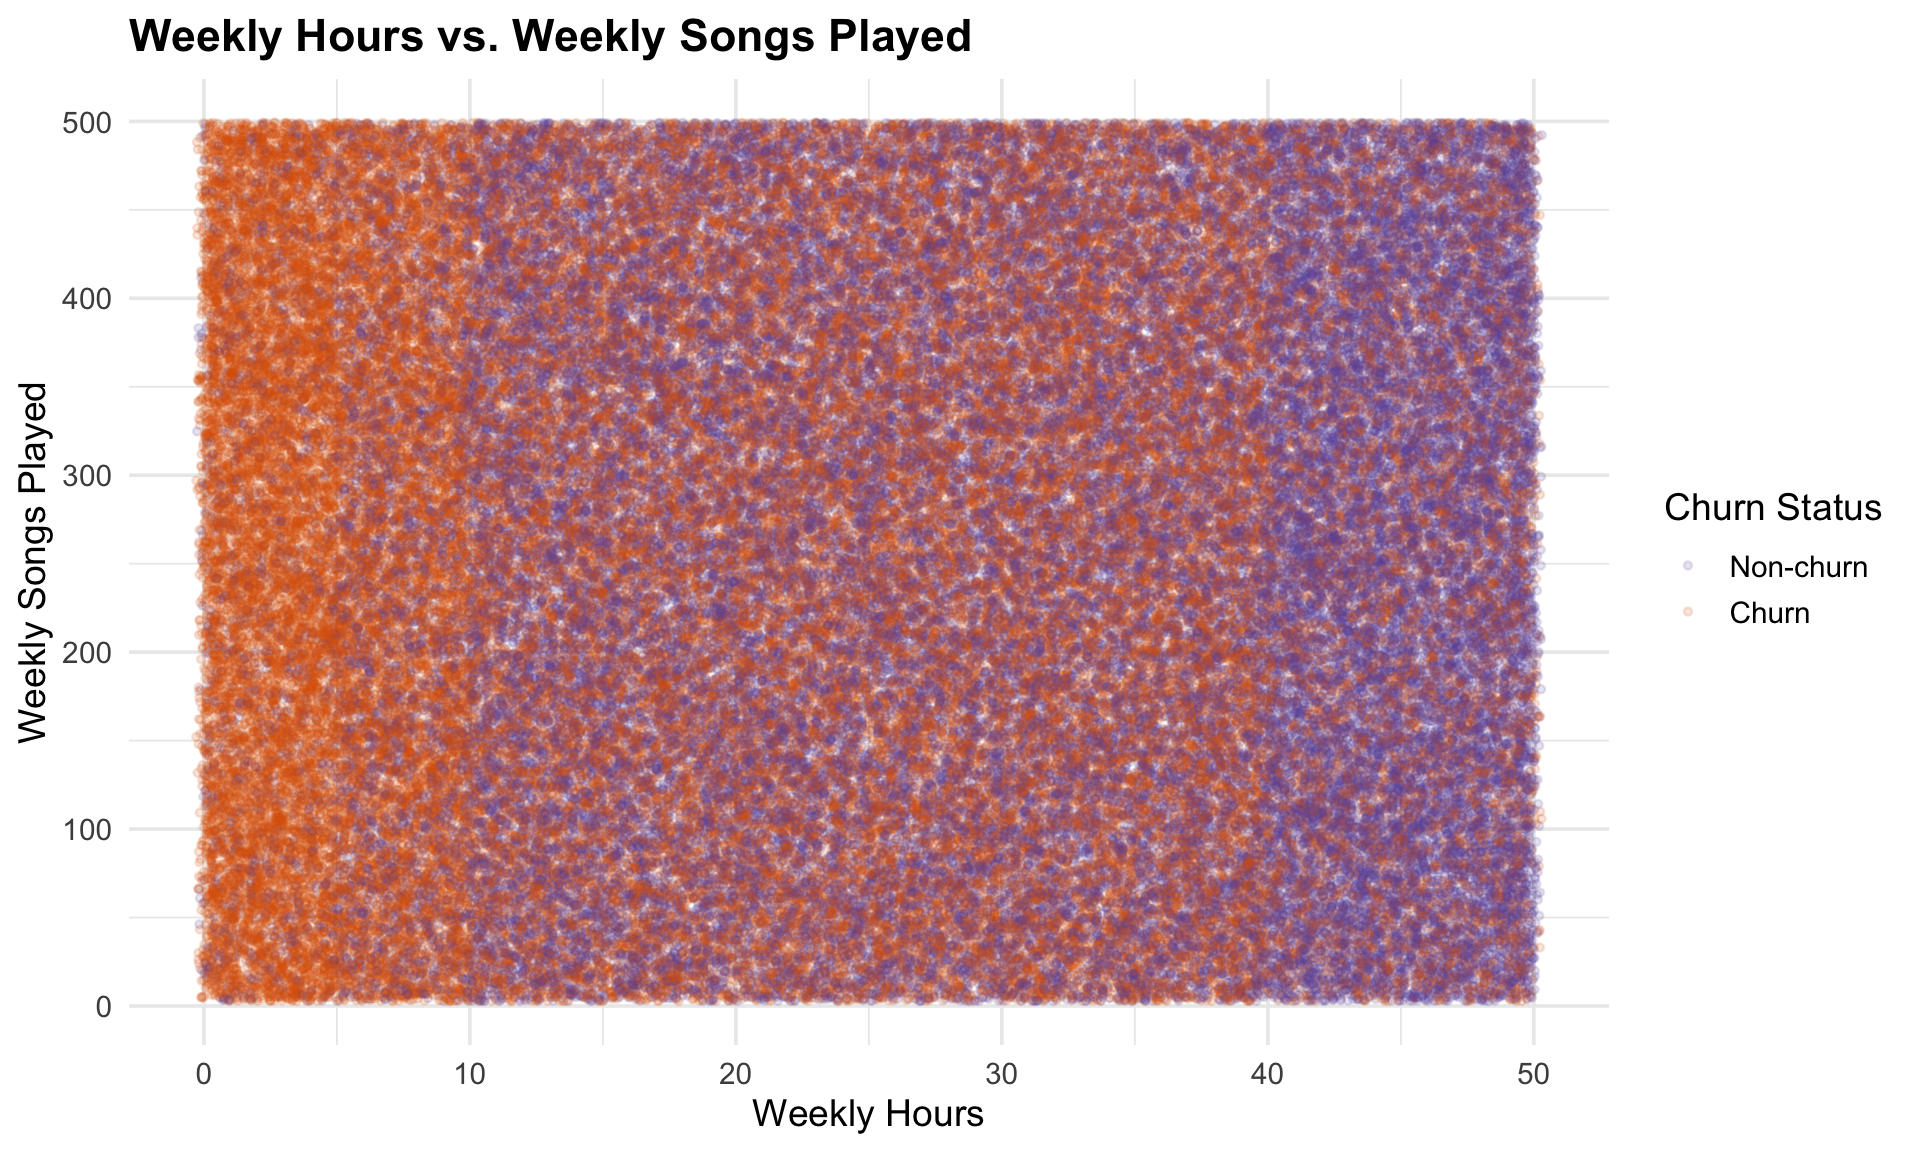
When we look at the scatter above, churned customers cluster more in the lower-left corner with fewer weekly hours and fewer songs played. This highlights that customers with minimal engagement are at higher risk of leaving, while heavier users (higher weekly hours and song counts) are more likely to remain loyal.
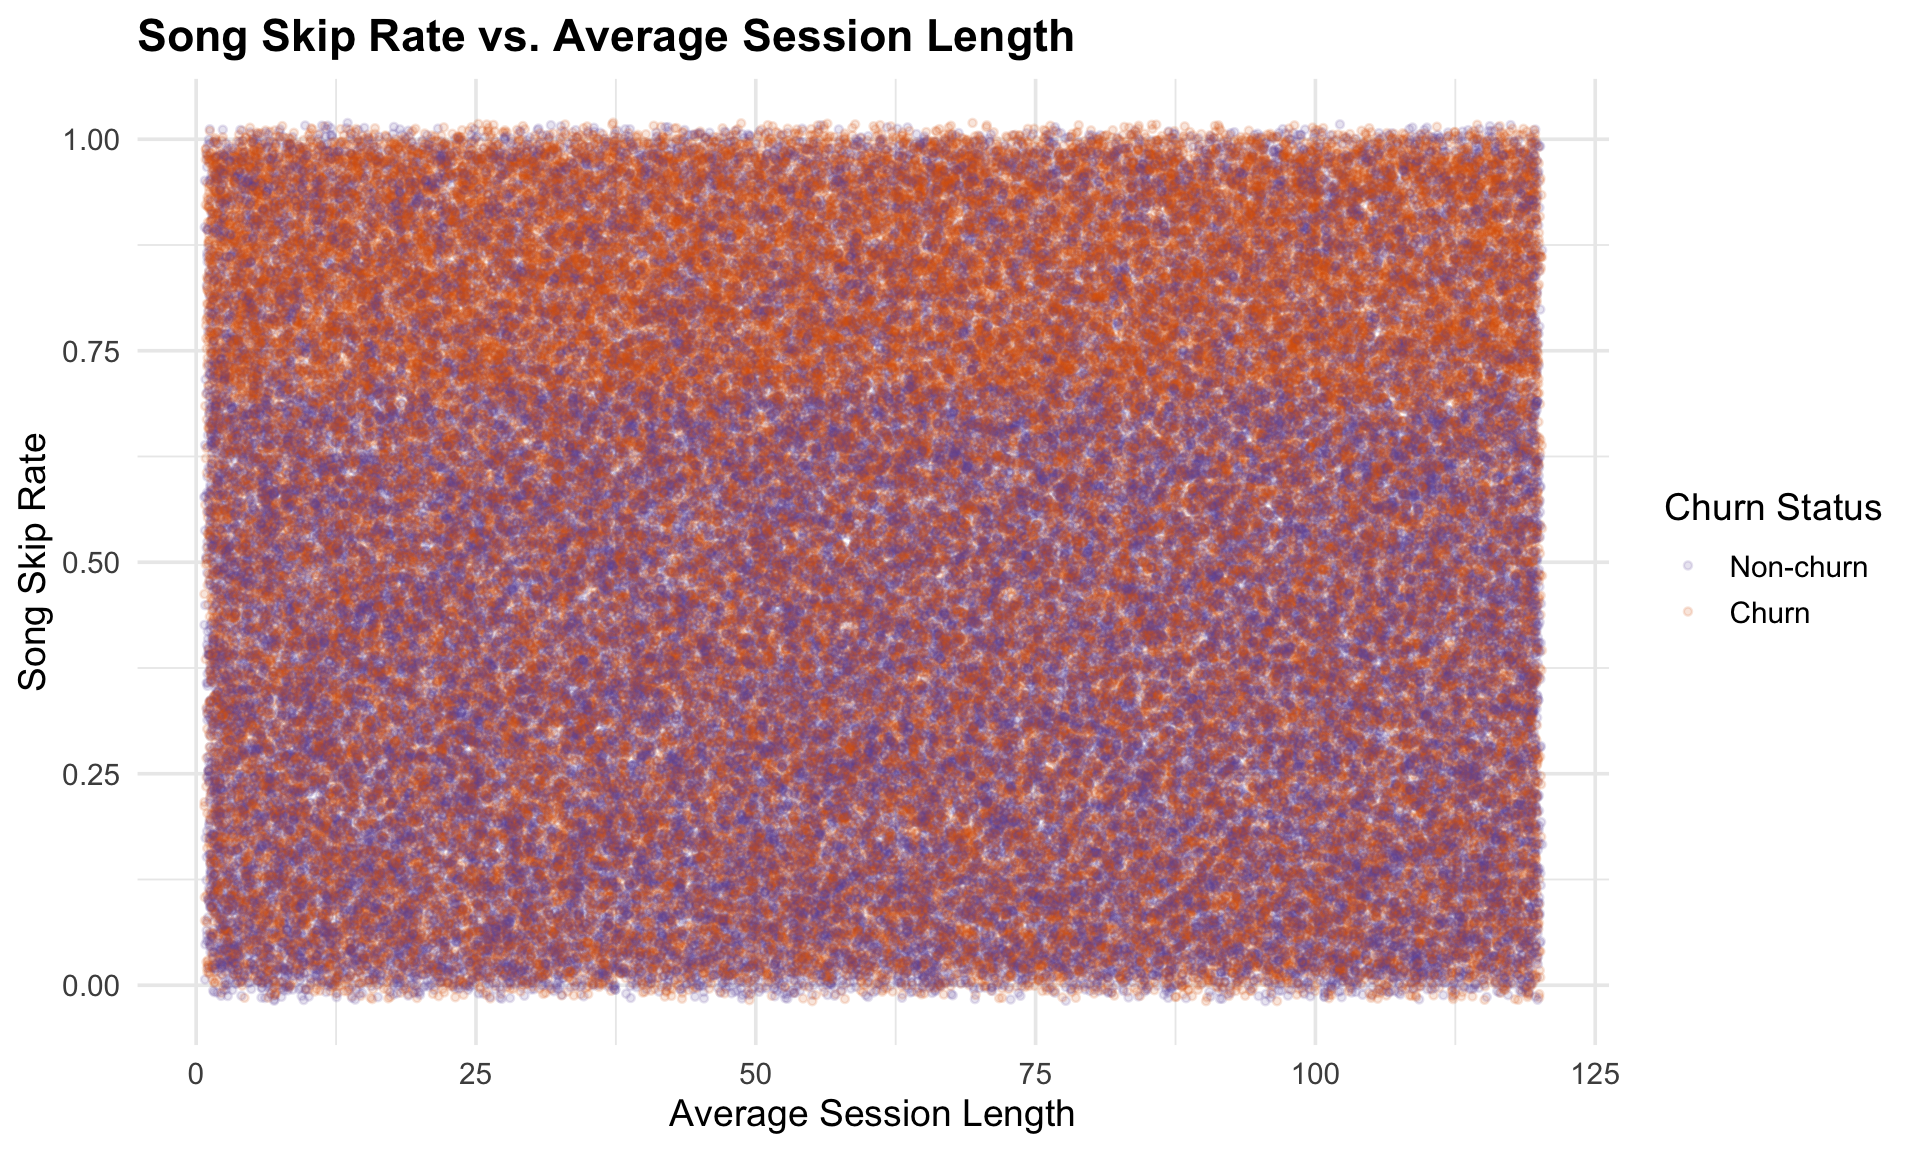
Here, we observe churned customers concentrated at higher skip rates across all session lengths. This suggests that dissatisfaction with music recommendations is a churn driver, regardless of how long customers spend per session. Non-churned users maintain lower skip rates, indicating better alignment between their expectations and platform experience.

Churn rates are consistent across all geographies, indicating no regional bias in customer retention or loss.
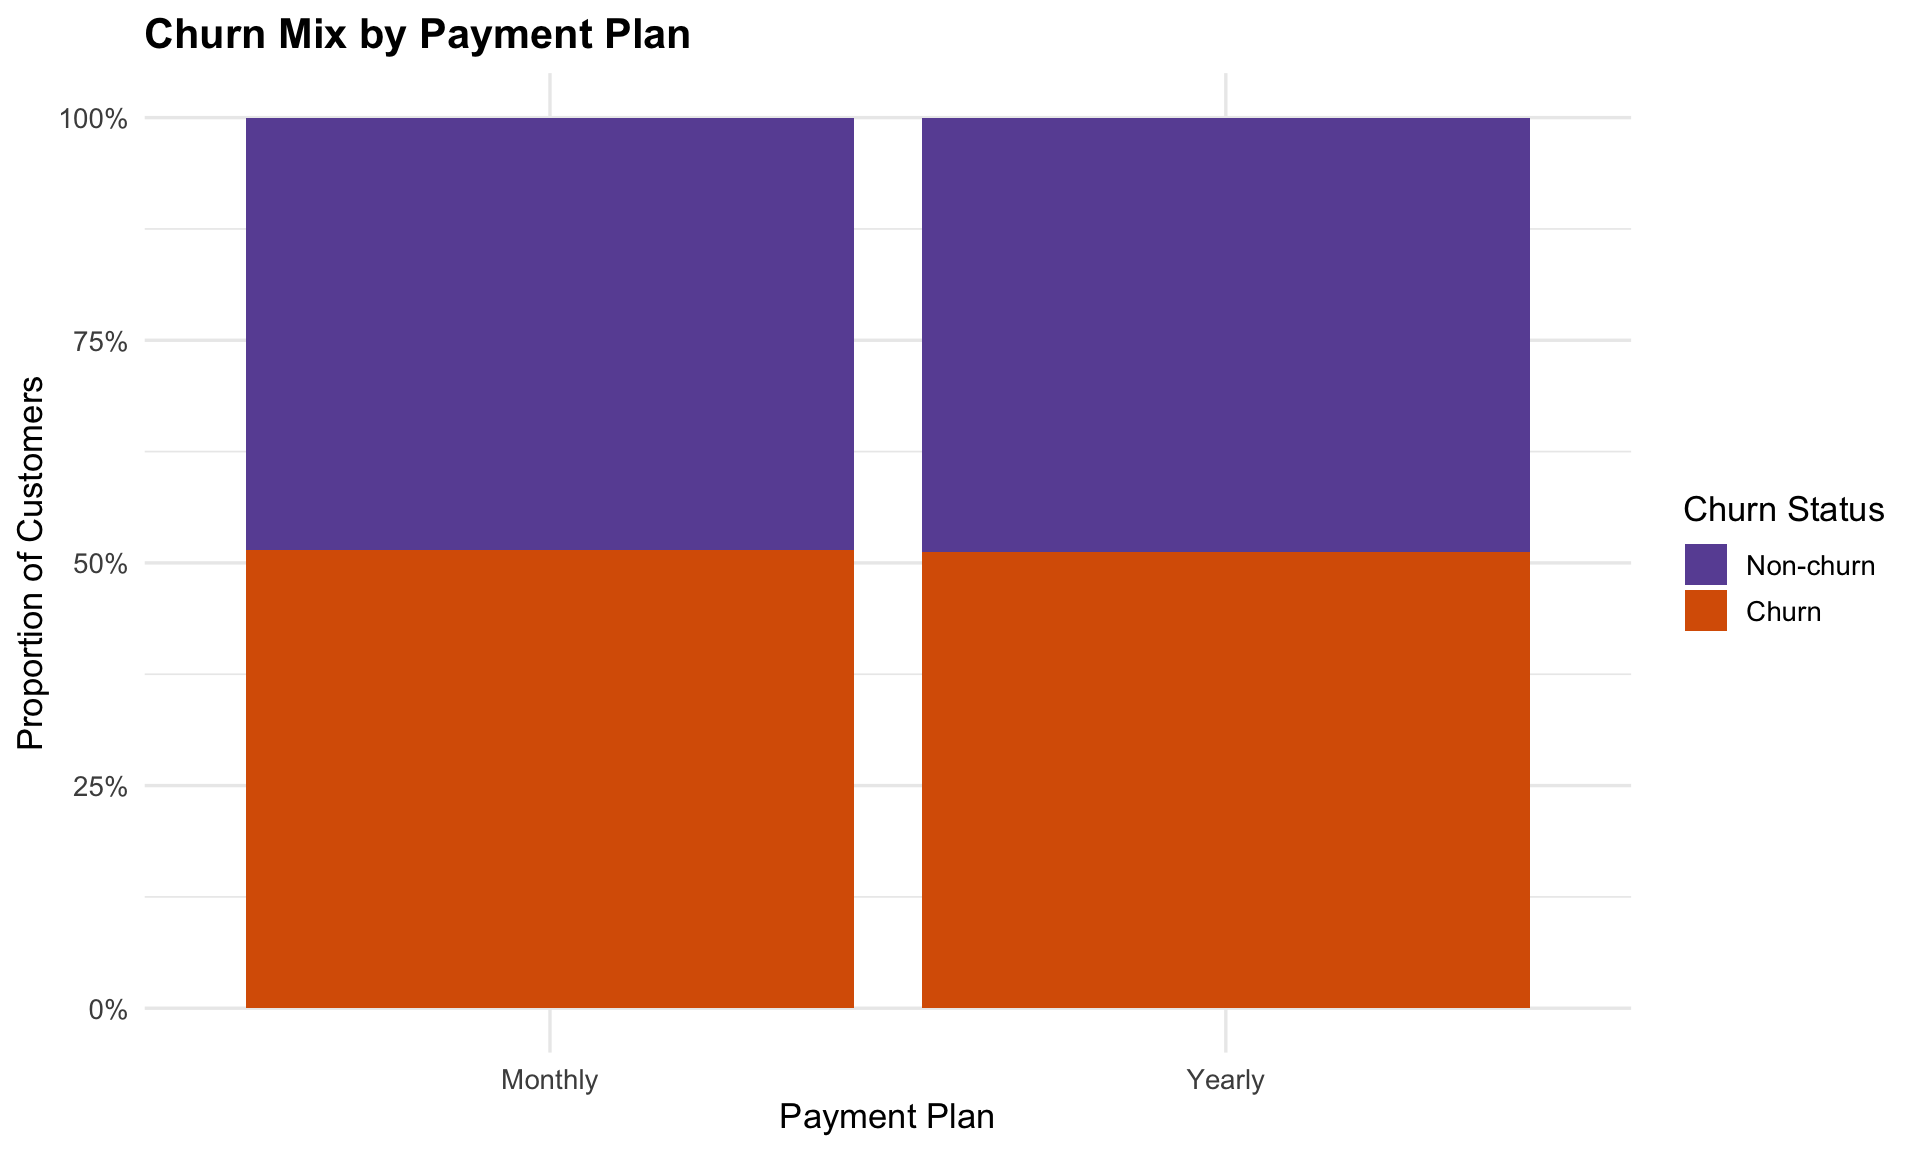
Monthly and yearly subscribers show nearly identical churn patterns, suggesting billing frequency has little effect on retention.
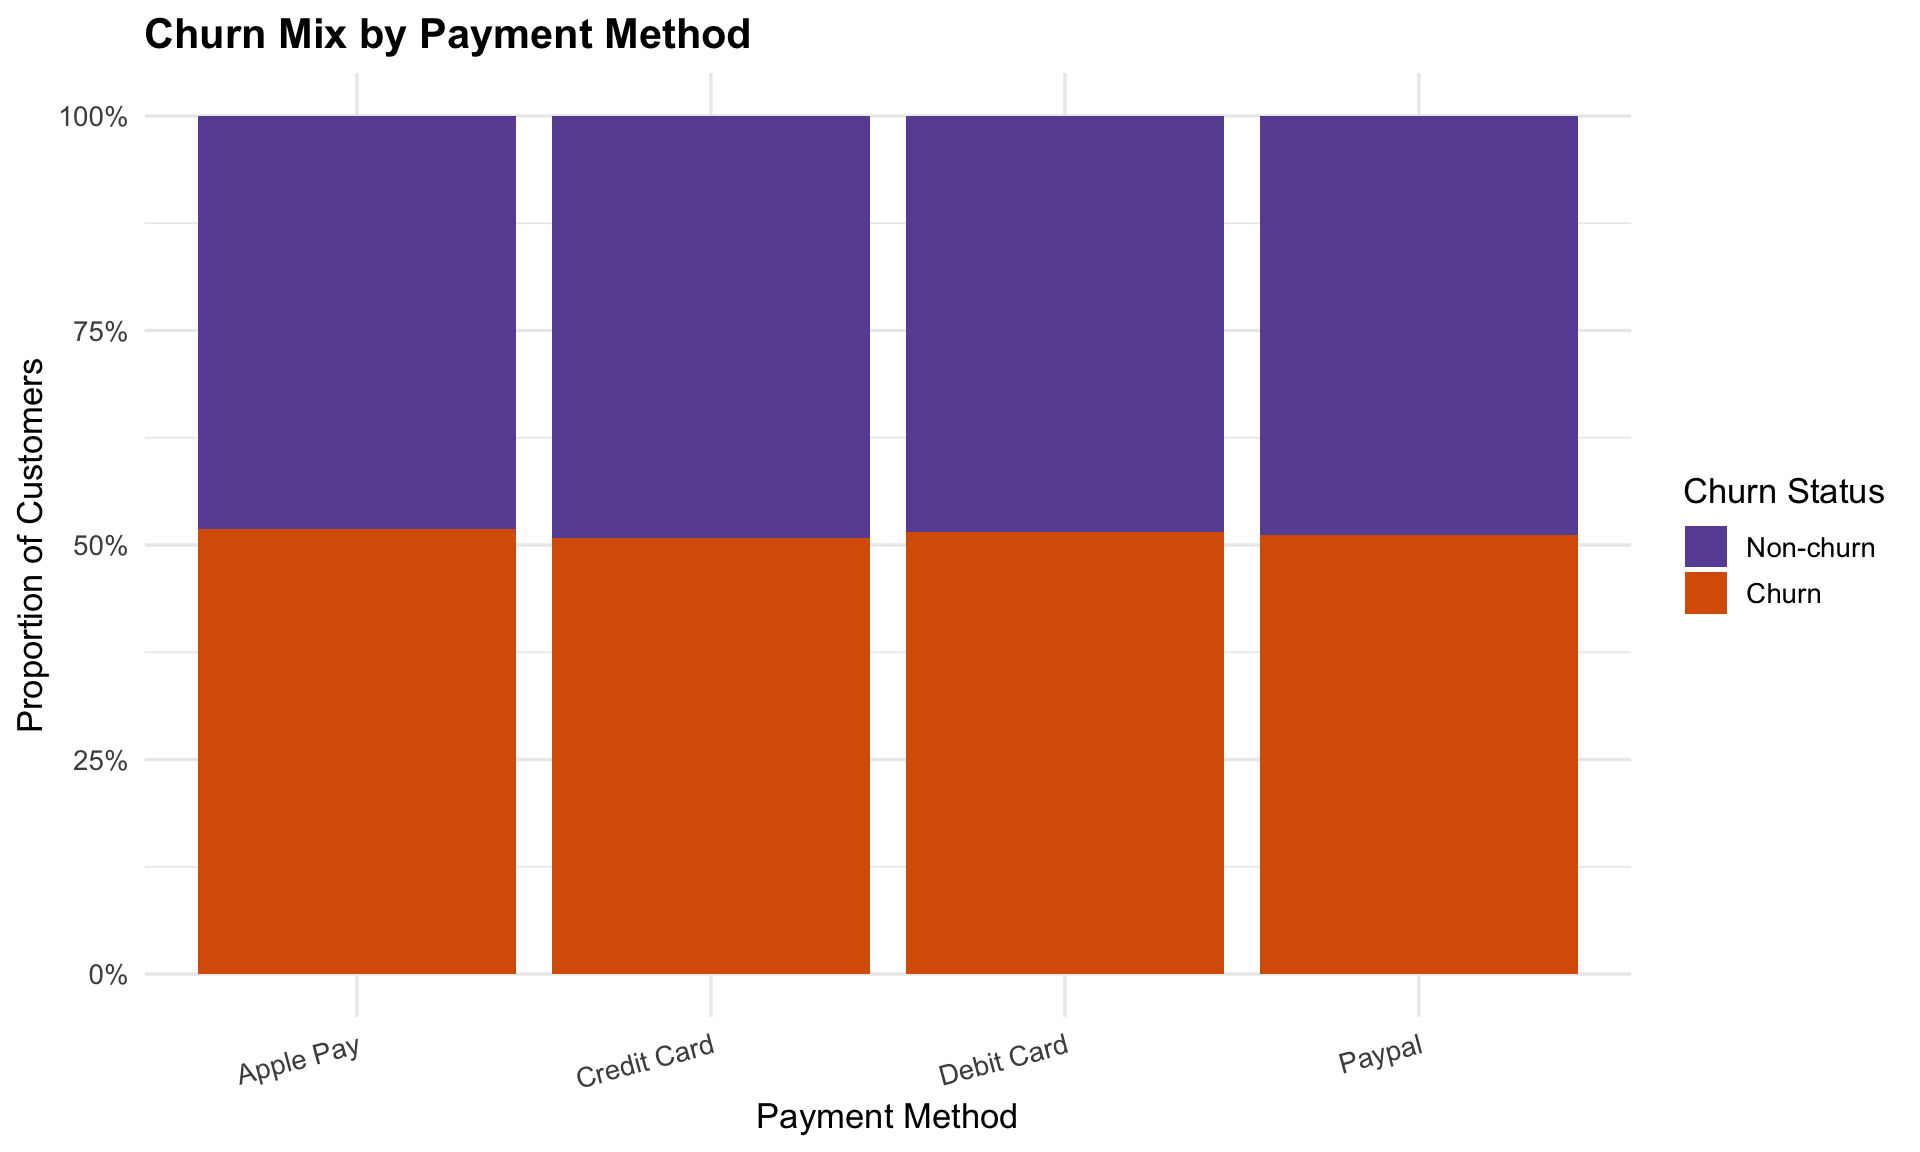
Churn distribution remains balanced across debit card, credit card, Apple Pay, and PayPal users, meaning payment choice is not a driver for churn.

Customers who contact service frequently are far more likely to churn, making inquiry volume a critical risk signal. This insight allows us to predict churn more accurately and design prescriptive actions that focus on reducing friction in the service experience, ultimately lowering churn rates.

The alluvial plot was created to examine how payment plans and payment methods flow into churn outcomes. It helps us see if billing preferences are linked to retention risk. The flows show that churn is evenly distributed across both monthly and yearly plans, as well as across all payment methods (credit card, debit card, Apple Pay, PayPal). In other words, how customers pay does not significantly influence whether they stay or leave.
Because our response variable is binary (churn vs. non-churn), the concept of outliers does not apply to it. Instead, we focused on the numeric predictors (x-variables) to check for anomalies. Using both z-score and IQR methos, no predictors showed extreme values outside accepted thresholds.
The dataset provided by the Data Engineering team contained no missing values. This was confirmed during our initial exploratory data analysis, ensuring that all variables are complete and reliable for downstream modeling.
Churn is nearly equal to retention, confirming it as a company-wide challenge. Low engagement, high skip rates, frequent subscription pauses, and heavy service inquiries are the clearest churn signals, while payment and location factors show no impact. With no missing values or anomalies, the data is reliable, and the focus now shifts to preparing it for model testing and evaluation, leading to the delivery of a predictive model that will quantify churn risk and support targeted retention strategies.
                Variable      N Z_Outliers Z_Pct IQR_Outliers IQR_Pct
                     age 125000          0     0            0       0
             signup_date 125000          0     0            0       0
            weekly_hours 125000          0     0            0       0
  average_session_length 125000          0     0            0       0
          song_skip_rate 125000          0     0            0       0
     weekly_songs_played 125000          0     0            0       0
     weekly_unique_songs 125000          0     0            0       0
 num_subscription_pauses 125000          0     0            0       0
    num_favorite_artists 125000          0     0            0       0
    num_platform_friends 125000          0     0            0       0
    num_shared_playlists 125000          0     0            0       0
notifications_clicked 125000 0 0 0 0 Variable MissingCount
1 customer_id 0
2 age 0
3 location 0
4 subscription_type 0
5 payment_plan 0
6 num_subscription_pauses 0
7 payment_method 0
8 customer_service_inquiries 0
9 signup_date 0
10 weekly_hours 0
11 average_session_length 0
12 song_skip_rate 0
13 weekly_songs_played 0
14 weekly_unique_songs 0
15 num_favorite_artists 0
16 num_platform_friends 0
17 num_playlists_created 0
18 num_shared_playlists 0
19 notifications_clicked 0
20 churned 0